- Why You Need to Understand Retracement Trading
- What Is a Retracement (Pullback)?
- Why Retracement Trading Works
- Pros and Cons of Retracement Trading
- Top Indicators for Spotting Retracements
- Popular Styles of Retracement Trading Strategy
- How to Start Using a Retracement Trading Strategy: Step-by-Step
- Real-World Example
- Tips for Beginners
- Final Thoughts
- 📌 Frequently Asked Questions (FAQ)
Why You Need to Understand Retracement Trading
If you’re just starting out in forex trading, you’ve likely seen prices move in one direction only to suddenly reverse—before continuing the original trend. That temporary reversal is called a retracement, also known as a pullback. Learning to recognize and trade these movements can give you a powerful edge.
In this guide, I’ll break down everything you need to know about retracement trading strategies in simple terms. By the end, you’ll know how to spot retracements, choose the right tools, and avoid common mistakes.
Written by Hassan Safari, Financial Risk Manager and CTO at a Forex Broker, with 7+ years of trading experience and 3 years in data science.
If you want pick a trading strategy , read this : Forex Trading Strategies: Proven Methods for Consistent Results
What Is a Retracement (Pullback)?
A retracement is a temporary price movement against the main trend. It’s not a full trend reversal—just a pause or dip before the market continues in the same direction.
Example:
If EUR/USD is in an uptrend and falls slightly before going back up, that dip is a retracement. Smart traders use this moment to enter the trade at a better price.
Why Retracement Trading Works
Markets never move in straight lines. Price movements are influenced by traders taking profits, news events, and institutional buying or selling. Retracement strategies aim to catch the “dip” in an uptrend or the “bounce” in a downtrend.
Key Insight: Most strong trends include multiple pullbacks. Trading them helps you enter with lower risk and better reward.
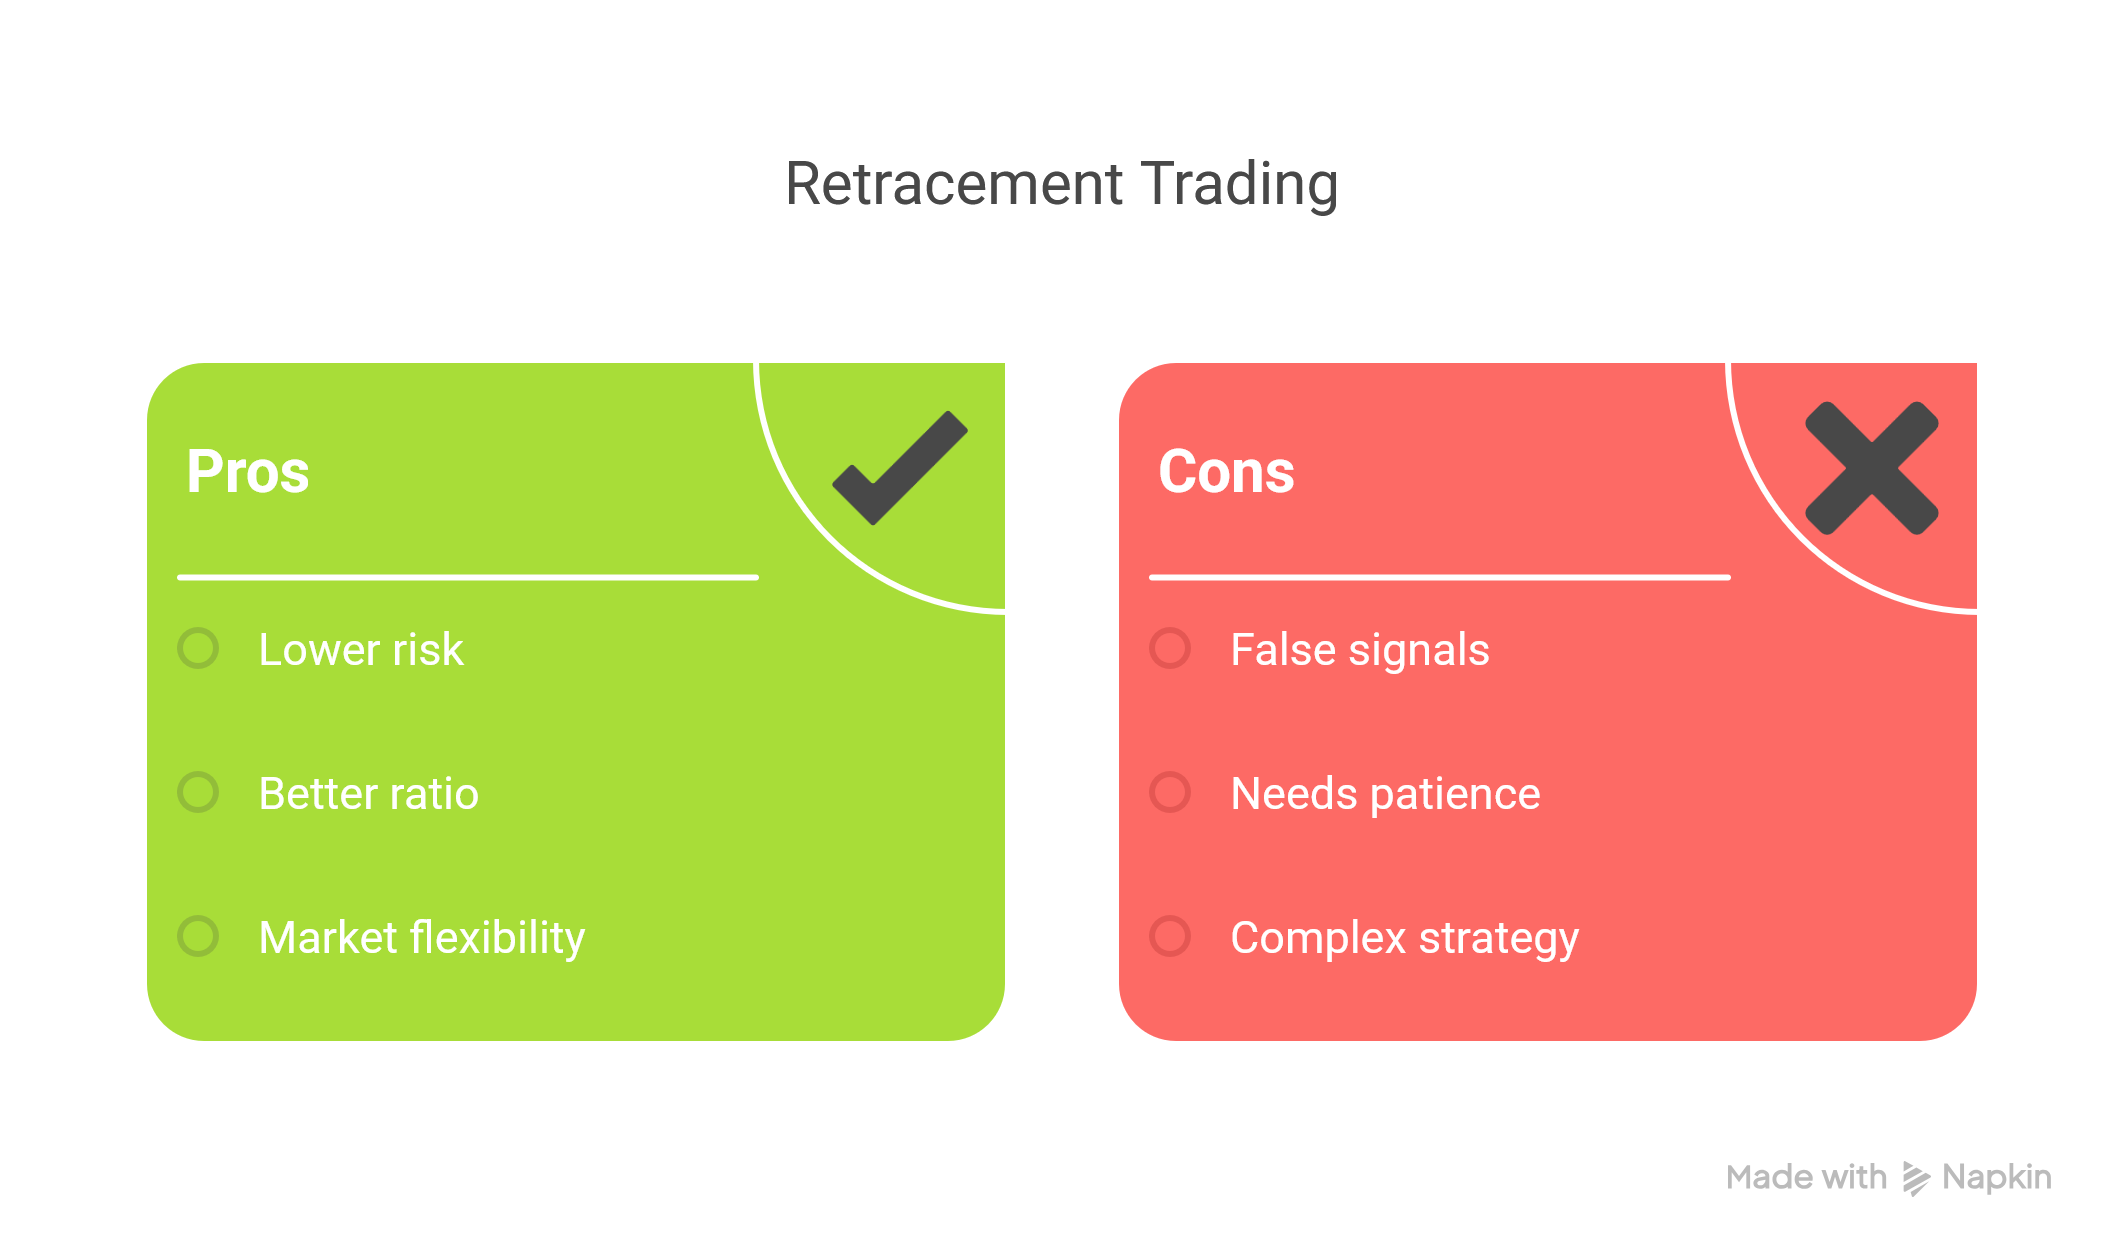
Pros and Cons of Retracement Trading
✅ Pros:
- Lower entry risk – You’re not chasing price highs.
- Better reward-to-risk ratio – You can set tighter stop-loss orders.
- Flexibility – Works in all markets: forex, crypto, stocks.
❌ Cons:
- False signals – Sometimes retracements turn into full reversals.
- Requires patience – Waiting for confirmation is essential.
- More complex than trend-following – Needs good chart reading skills.
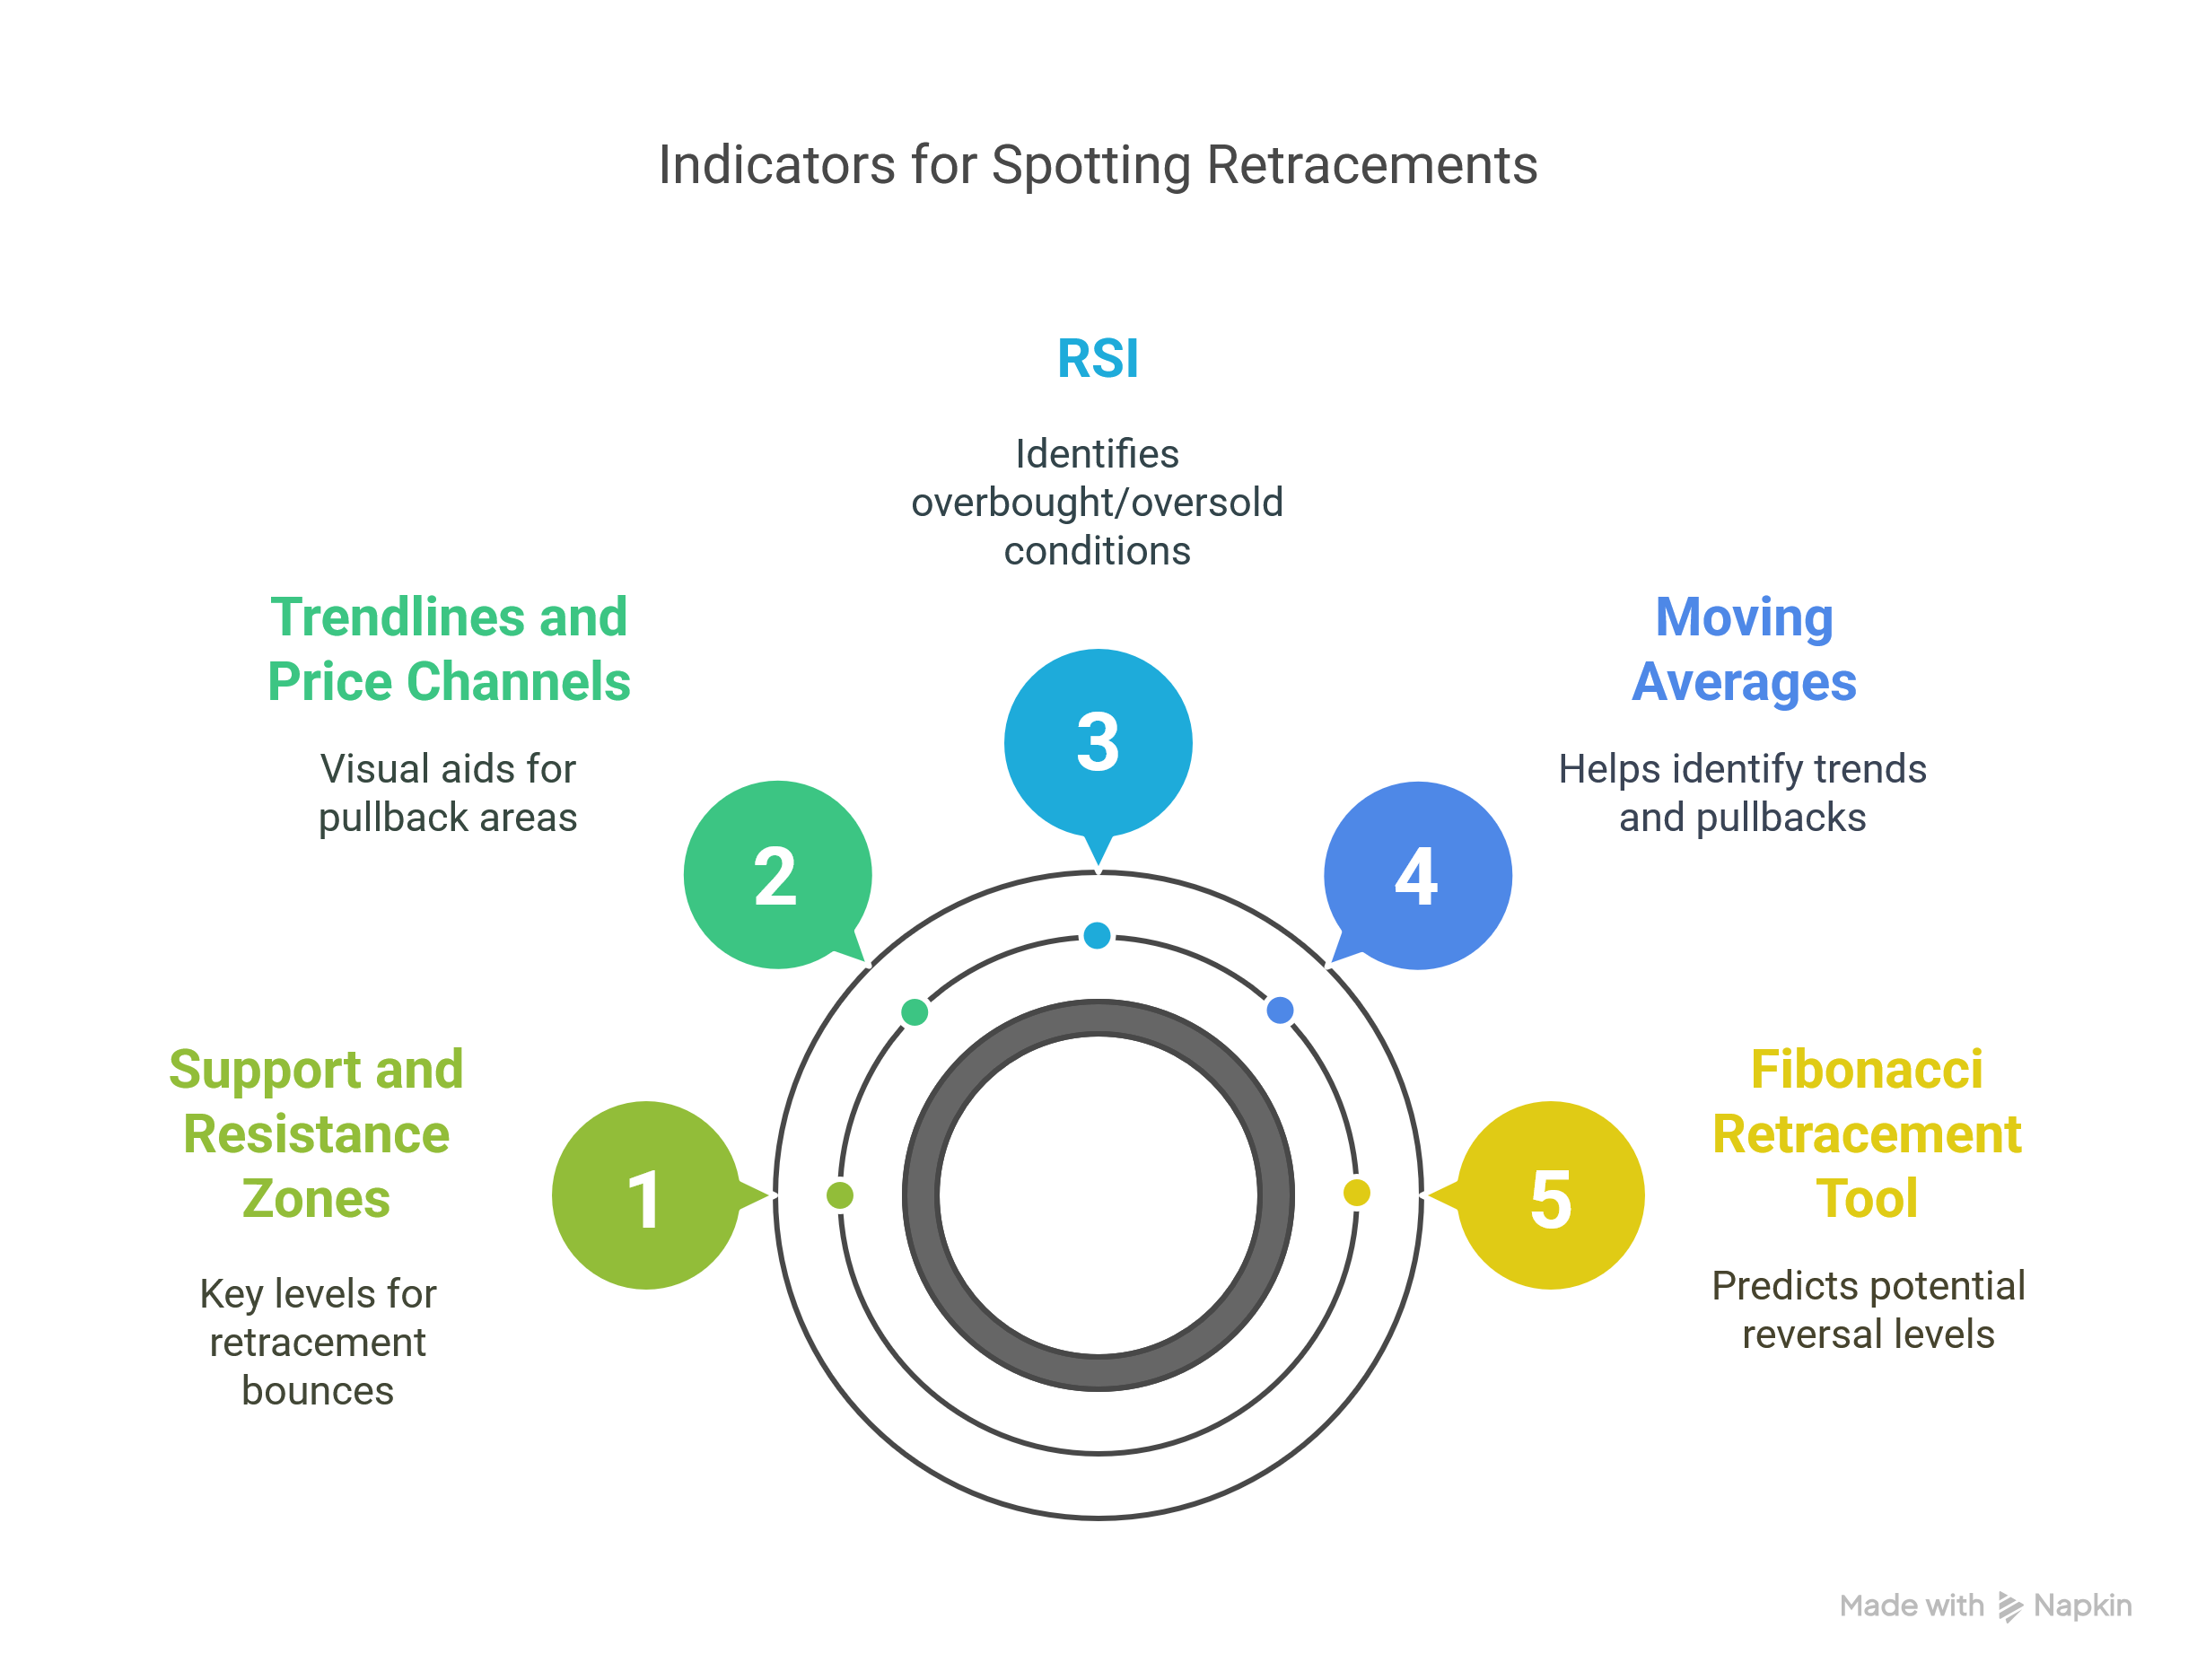
Top Indicators for Spotting Retracements
1. Fibonacci Retracement Tool
Widely used to predict levels where price might reverse temporarily. Common levels: 38.2%, 50%, 61.8%.
2. Moving Averages (MAs)
Short-term MAs (like the 20 EMA) help identify the main trend and potential pullback zones.
3. RSI (Relative Strength Index)
Helps spot overbought or oversold conditions during pullbacks.
4. Trendlines and Price Channels
Drawing trendlines can visually highlight pullback areas.
5. Support and Resistance Zones
Often, retracements bounce off key support/resistance levels.
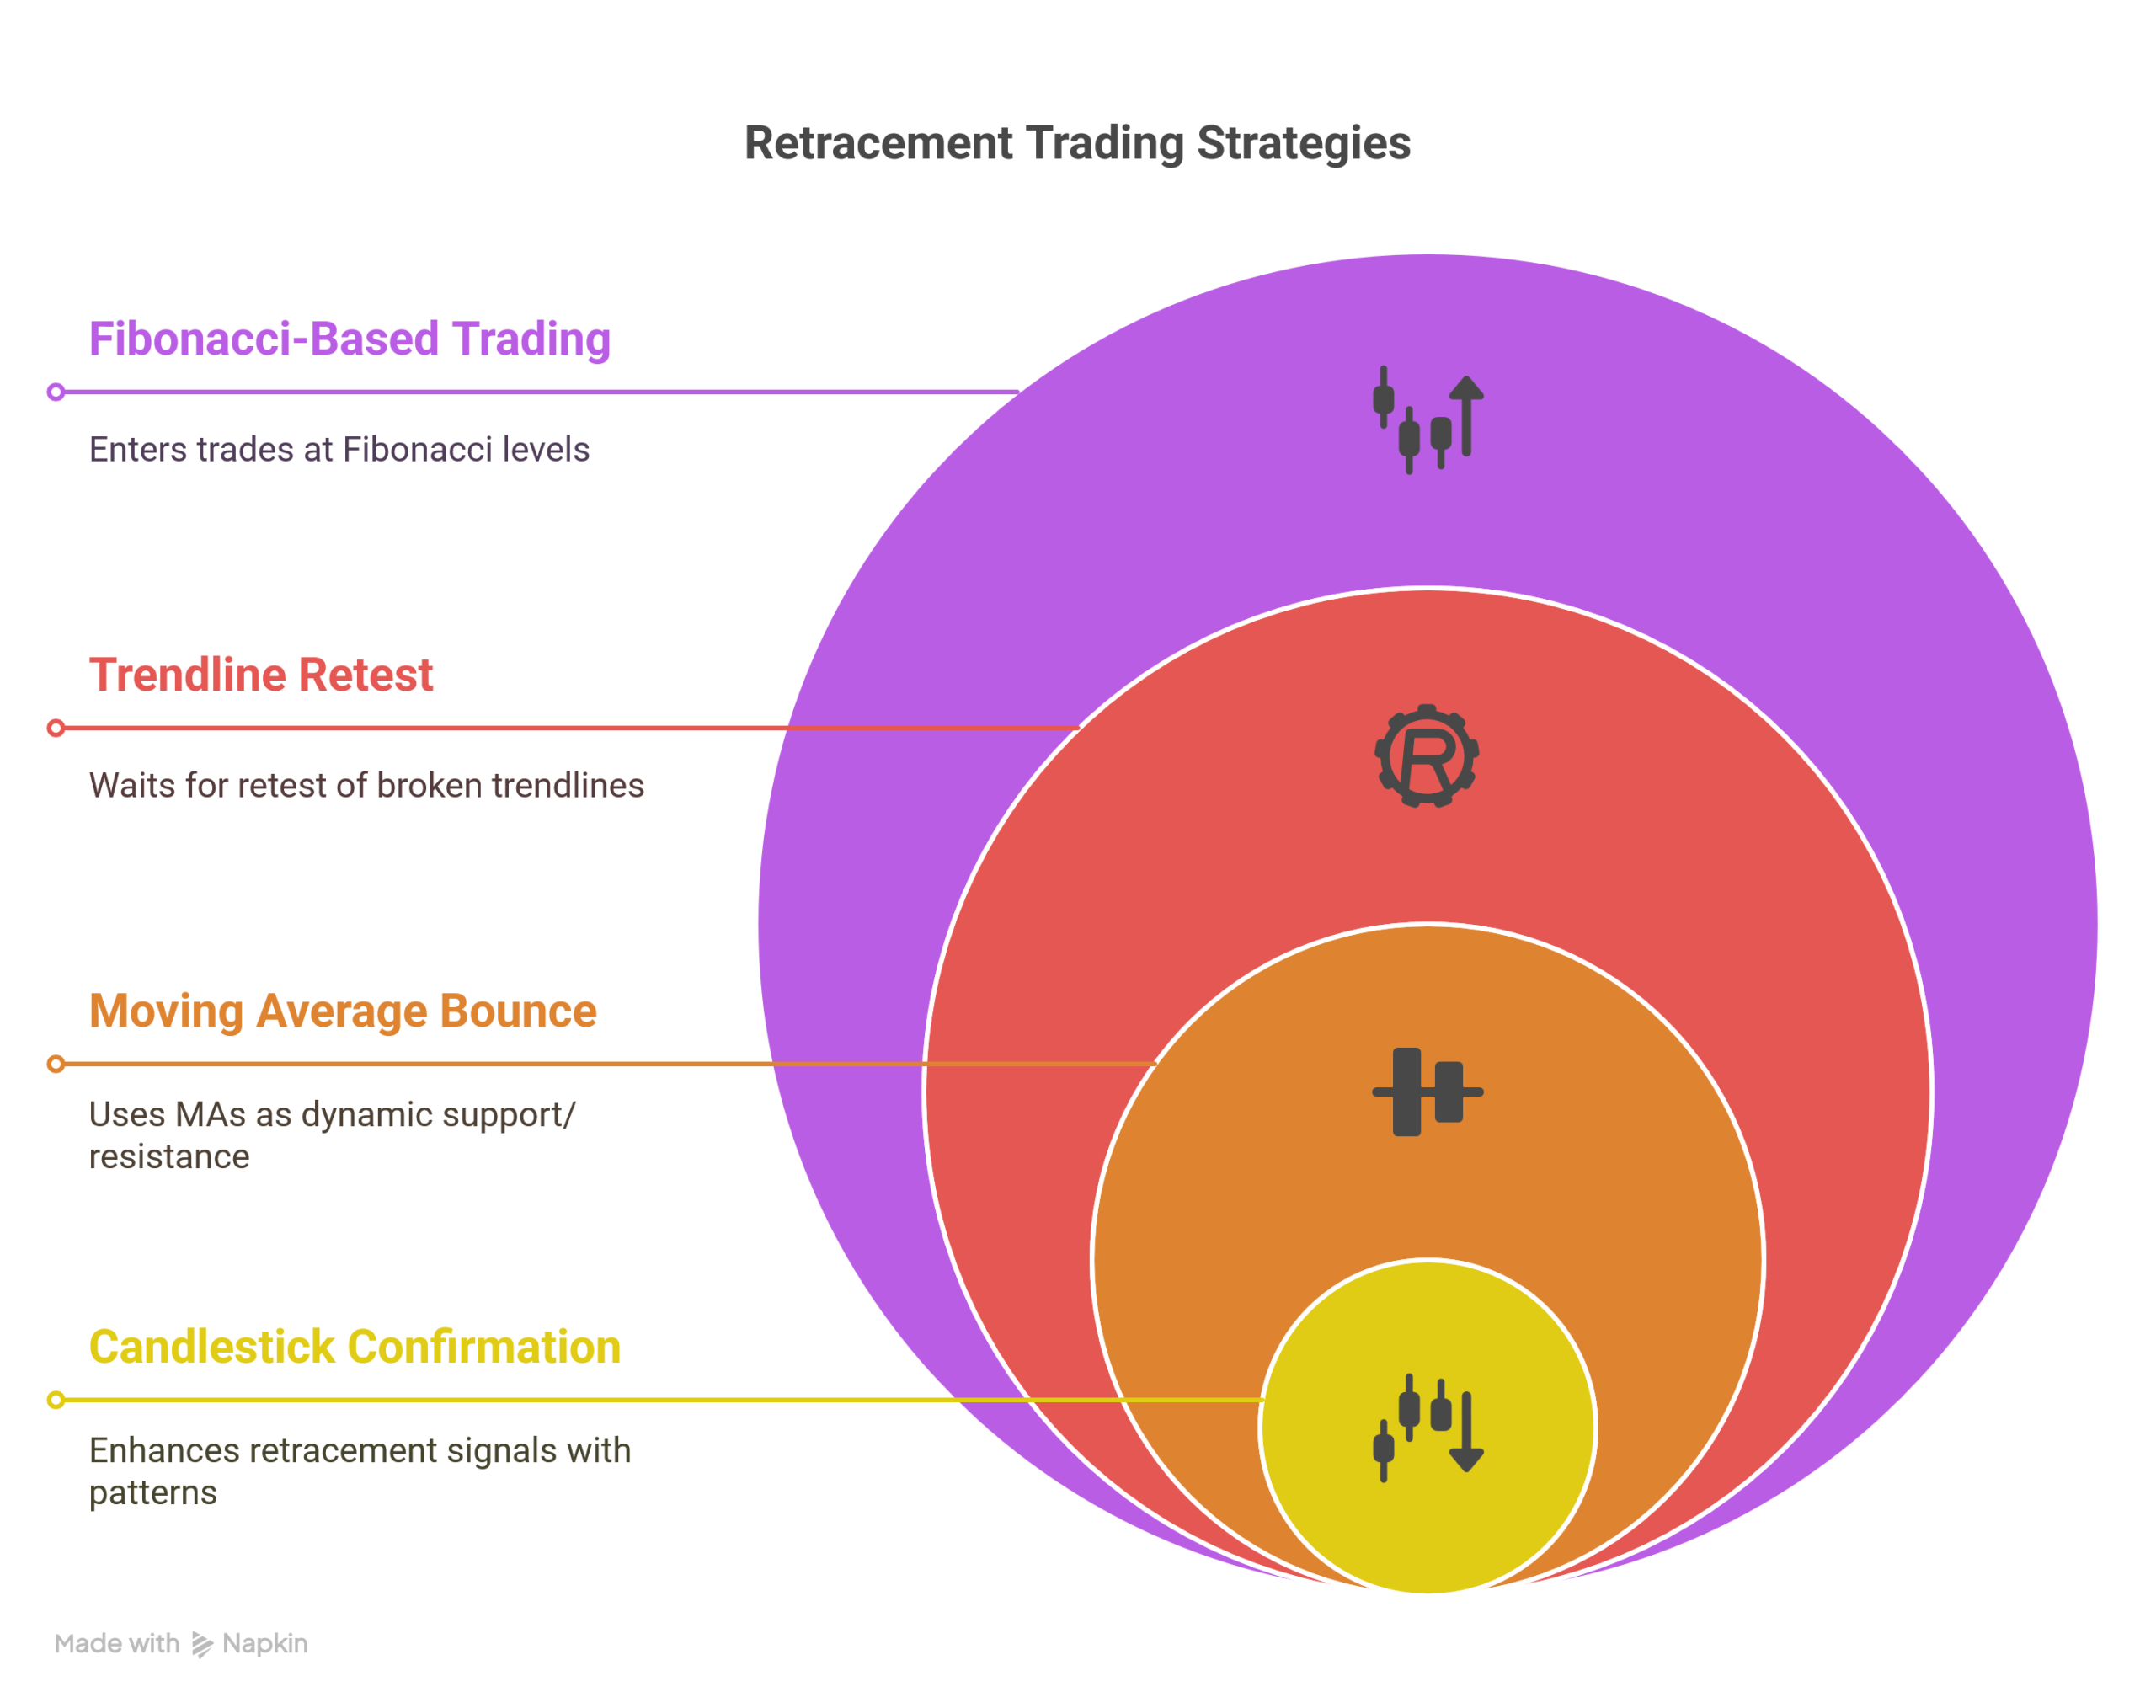
Popular Styles of Retracement Trading Strategy
A. Fibonacci-Based Trading
Enter trades around the 38.2%, 50%, or 61.8% retracement levels after a trend.
B. Trendline Retest Strategy
Wait for a price to pull back and retest a broken trendline or horizontal support.
C. Moving Average Bounce
Use the 20 or 50 EMA as dynamic support/resistance for pullbacks.
D. Candlestick Confirmation Style
Combine retracements with candlestick patterns (like pin bars) for added confirmation.
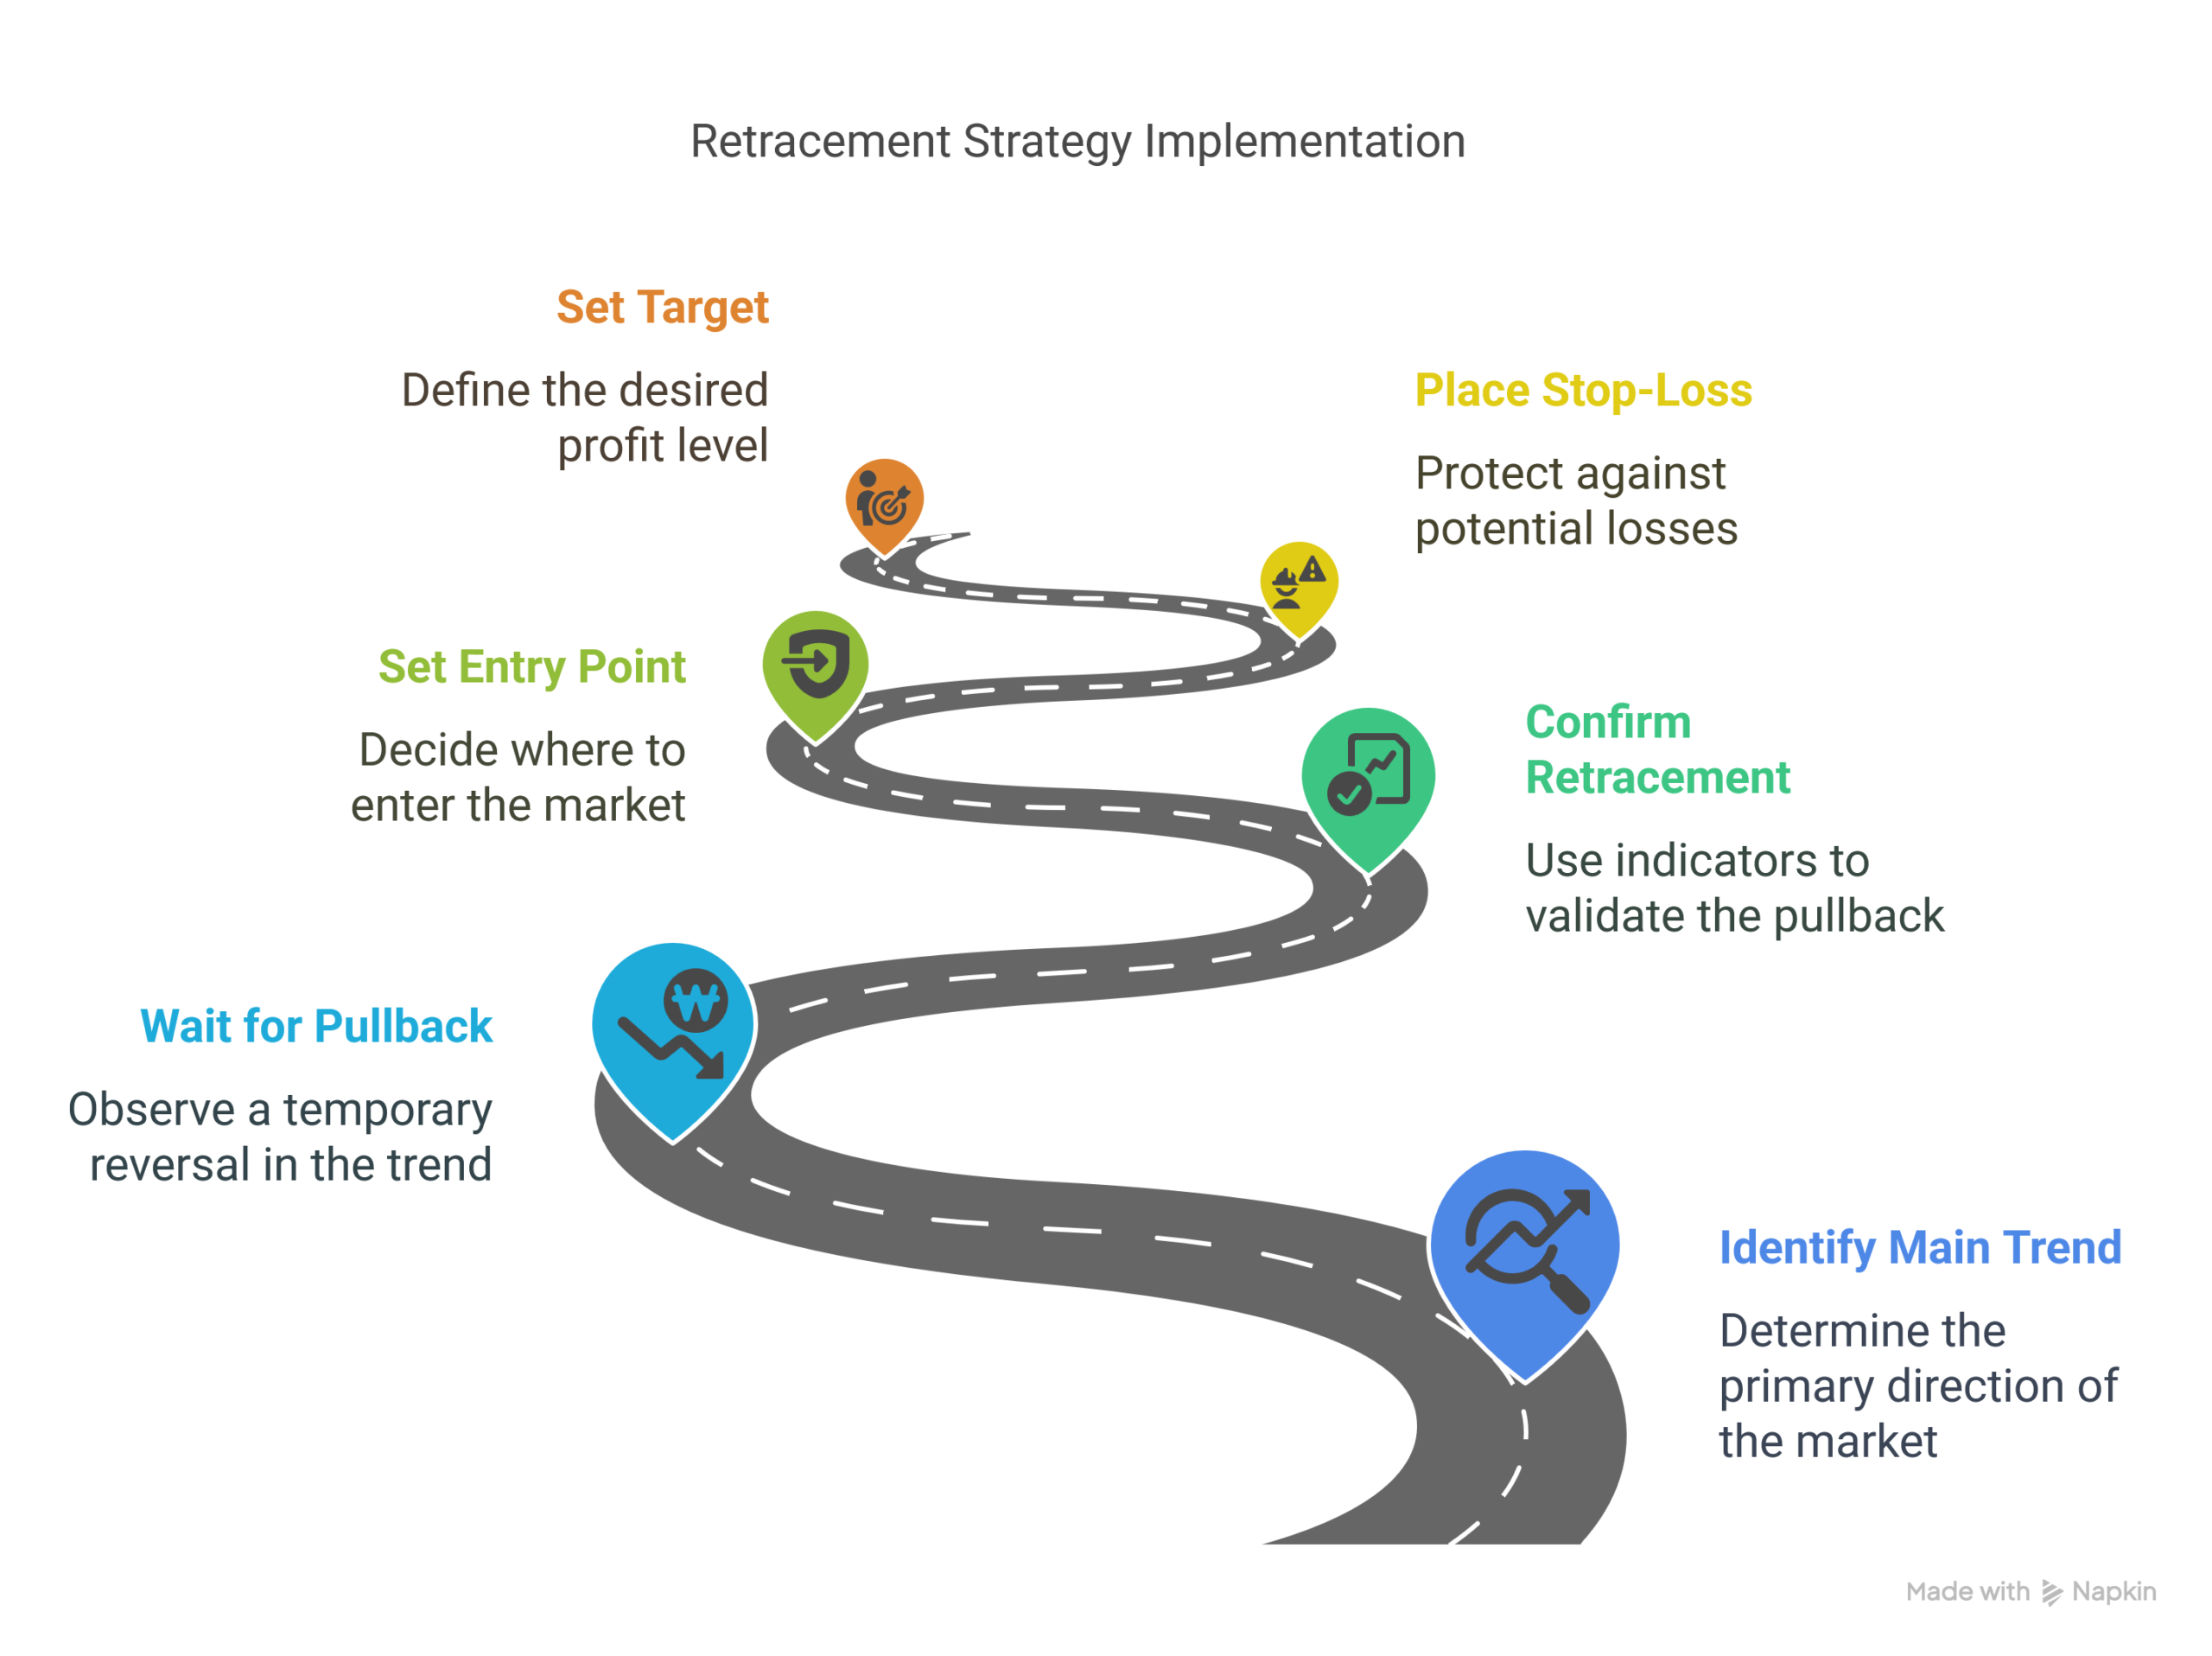
How to Start Using a Retracement Trading Strategy: Step-by-Step
- Identify the main trend (use MAs or trendlines).
- Wait for a pullback – Look for a dip in an uptrend or a bounce in a downtrend.
- Confirm the retracement – Use RSI, Fibonacci, or candlestick signals.
- Set your entry point – Enter near the retracement level.
- Place your stop-loss – Below/above recent swing high/low.
- Set your target – Based on previous highs/lows or risk-reward ratio.
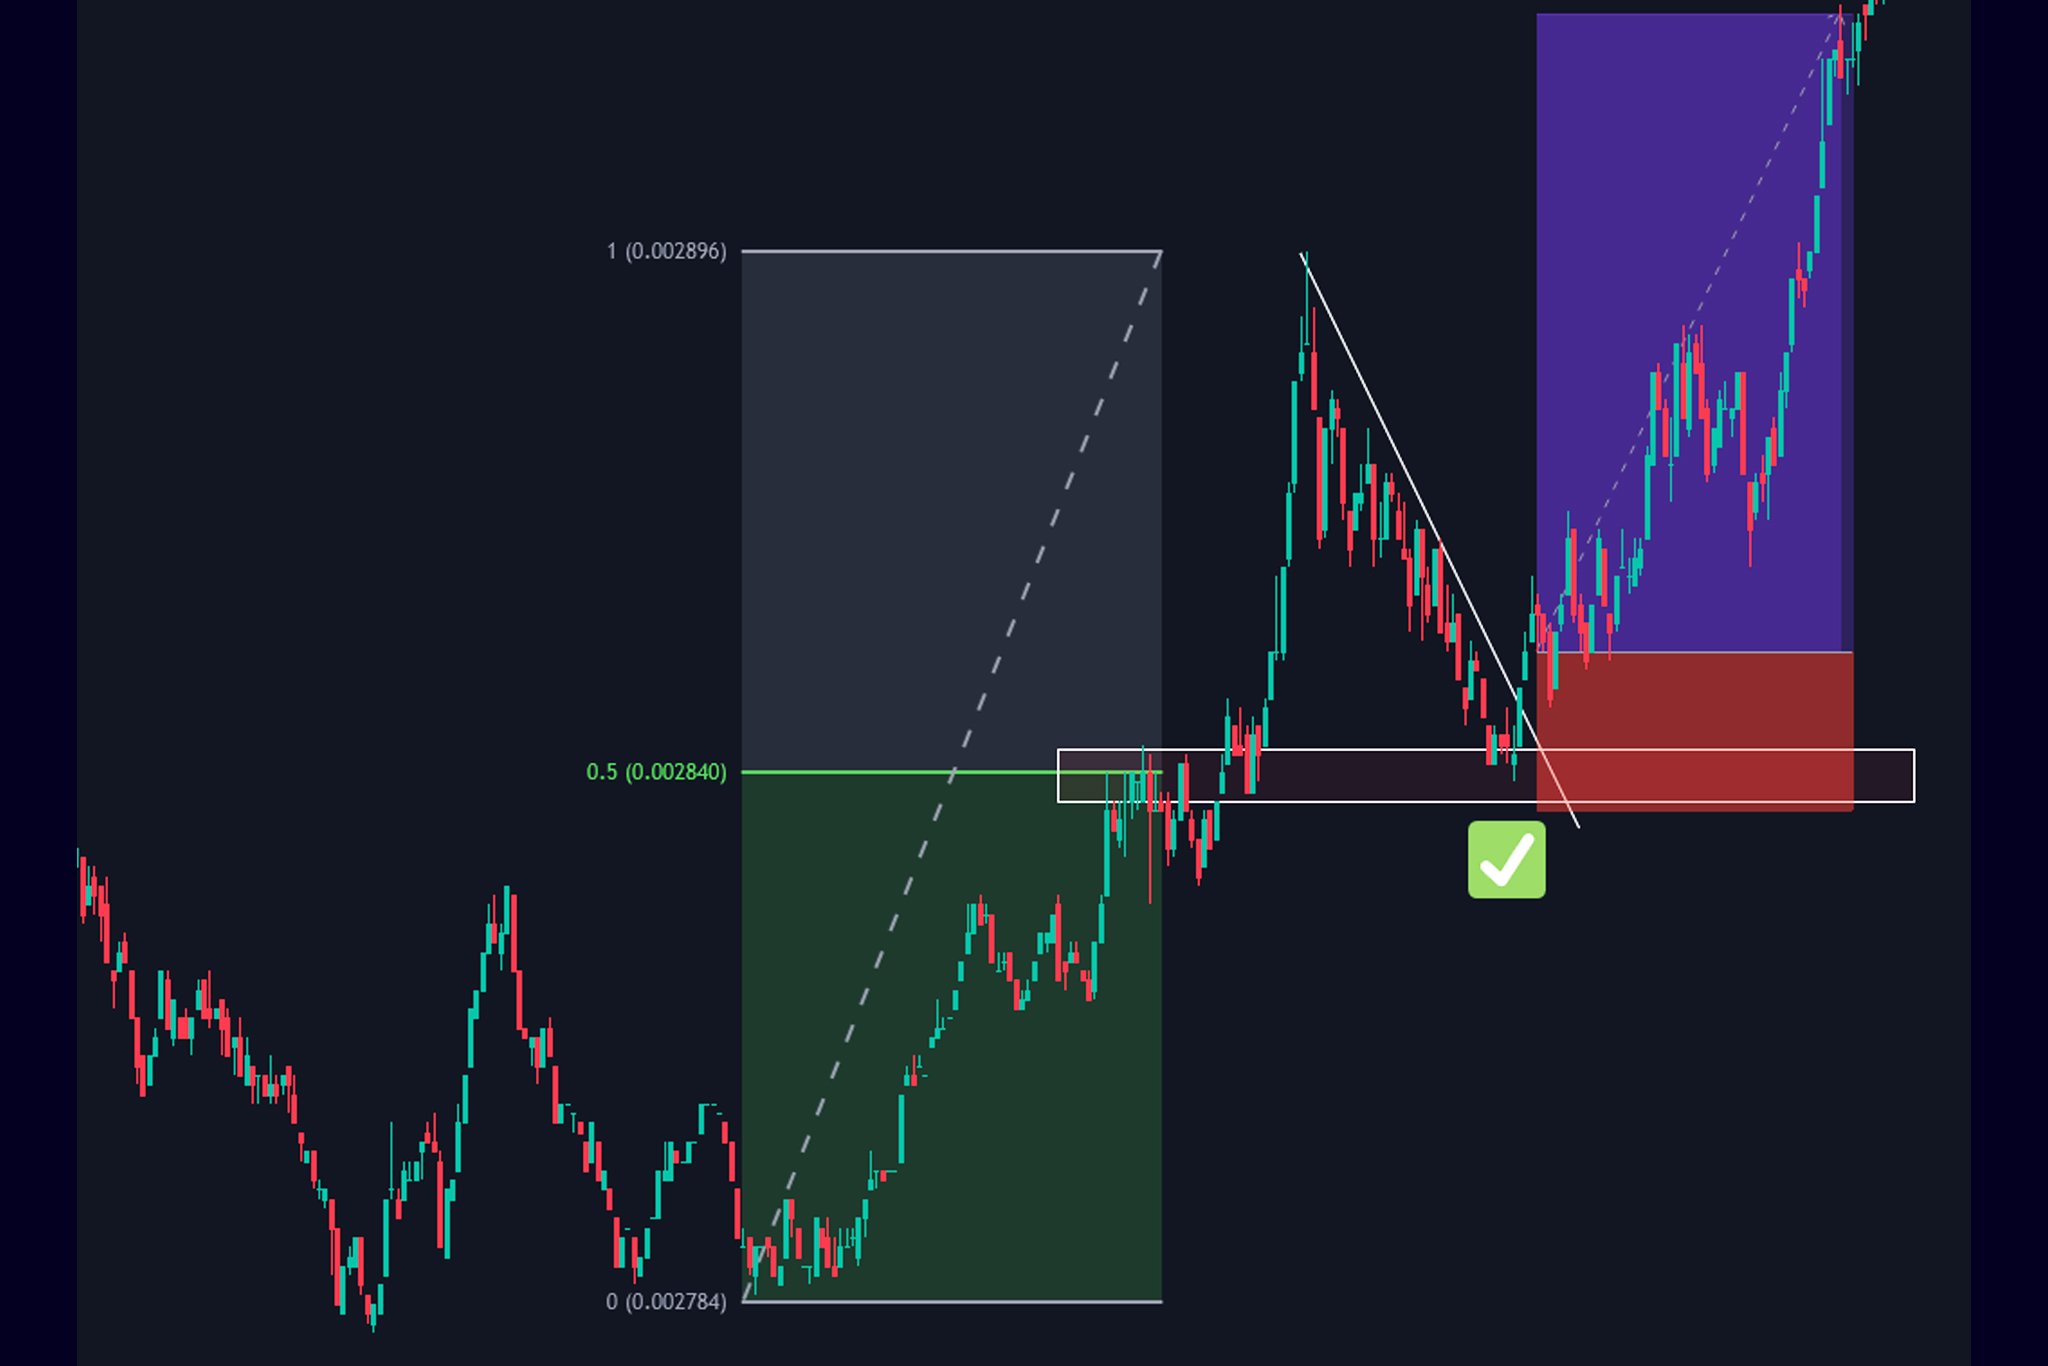
Real-World Example
Let’s say in March 2025, GBP/USD is in a strong uptrend. The pair pulls back to the 50% Fibonacci level after a rally. An RSI reading shows oversold and a bullish engulfing candle forms.
Action: A trader enters long at the 50% level, stops below the 61.8% line, and targets previous highs. This method gave a 2:1 reward-to-risk setup.
Tips for Beginners
- Don’t trade every pullback. Wait for confirmation.
- Use demo accounts first. Practice identifying real vs. false pullbacks.
- Combine tools. Don’t rely on just one indicator.
- Keep your charts clean. Too many indicators cause confusion.
Final Thoughts
Retracement (pullback) trading offers a structured, lower-risk way to enter trades during trends. While it requires practice and patience, it rewards traders who learn to read the market correctly.
Whether you’re trading EUR/USD or Bitcoin, this strategy can help you enter with confidence rather than chasing price.
📌 Frequently Asked Questions (FAQ)
A pullback is a short-term move against the current trend. Think of it as a “pause” in the market where price temporarily dips before continuing in the original direction. It gives traders a chance to enter the market at a better price.
Imagine EUR/USD is rising from 1.0800 to 1.1000. Suddenly, it drops back to 1.0900 before rising again. That dip to 1.0900 is a pullback—a temporary decline during an uptrend.
To use it: 1. Identify the main trend.
2. Wait for a small reversal (pullback).
3. Use tools like Fibonacci levels or RSI to confirm it.
4. Enter the trade when signs show the trend is resuming.
5. Set your stop-loss and target wisely.
This is a focus strategy:
– 5 markets to trade
– 3 strategies to master
– 1 time to trade (your best session)
It helps traders stay consistent and avoid distractions.
This unofficial rule says 90% of traders lose 90% of their money in the first 90 days. It’s a warning: take your time, study strategies like pullbacks, and manage risk wisely.
It suggests spending 70% of your time analyzing trades and 30% actually trading. Planning is more important than action in the long run.
The most quoted rule: “Don’t lose money.” In practice, this means managing risk, using stop-losses, and not overtrading.
Though Buffett is a long-term investor, not a trader, his method involves buying quality assets at a discount and holding for the long run. This aligns with the idea of waiting for a “pullback” before buying.
This strategy isn’t widely used in trading but is often applied to time or budget management:
– 65% of effort on main focus
– 35% on learning/growth
– 20% buffer time/money.
Traders can adapt it to balance trading, learning, and reviewing.
Yes! It’s one of the safest ways to enter a trade because you’re not chasing price. You wait for better entries and use clear tools like Fibonacci or moving averages.
A pullback is temporary; the trend continues. A reversal is when the trend completely changes direction. Recognizing the difference is key to trading success.
Look for confirmation signals:
– RSI or MACD support
– Candlestick patterns (like pin bars)
– Holding above/below a key support/resistance zone.
Based on current trends:
– Fibonacci retracements
– RSI and MACD
– Trendlines
– 20/50 EMA
These tools are reliable and beginner-friendly.
There’s no fixed number. Your earnings depend on:
– Risk management
– Strategy consistency
– Market conditions
Many traders aim for a 2:1 reward-to-risk ratio, meaning they risk $100 to make $200 per trade.


