- Why You Should Learn Range Trading
- What Is Range Trading?
- Key Features of Range Trading
- Advantages of Range Trading
- Disadvantages
- Tools & Indicators for Range Trading
- Range Trading Systems and Algorithms (Beginner Friendly)
- Step-by-Step: How to Trade a Range Like a Pro
- Real-Life Example
- Pro Tips for Better Results
- Summary: Why Range Trading Works for Beginners
- 📌 Frequently Asked Questions (FAQ)
- Next Steps
Why You Should Learn Range Trading
If you’re new to forex trading, you might assume that the market always moves in trends. But here’s a surprising fact: markets range up to 70% of the time. That means most of the time, prices move sideways rather than trending up or down.
This creates an excellent opportunity for beginners who want a clear, structured strategy: the Range Trading Strategy. In this guide, we’ll cover everything from what range trading is, how it works, indicators, systems, algorithms, and a step-by-step strategy you can start using today.
if you dont know which strategy you want to trade read this : Forex Trading Strategies: Proven Methods for Consistent Results
What Is Range Trading?
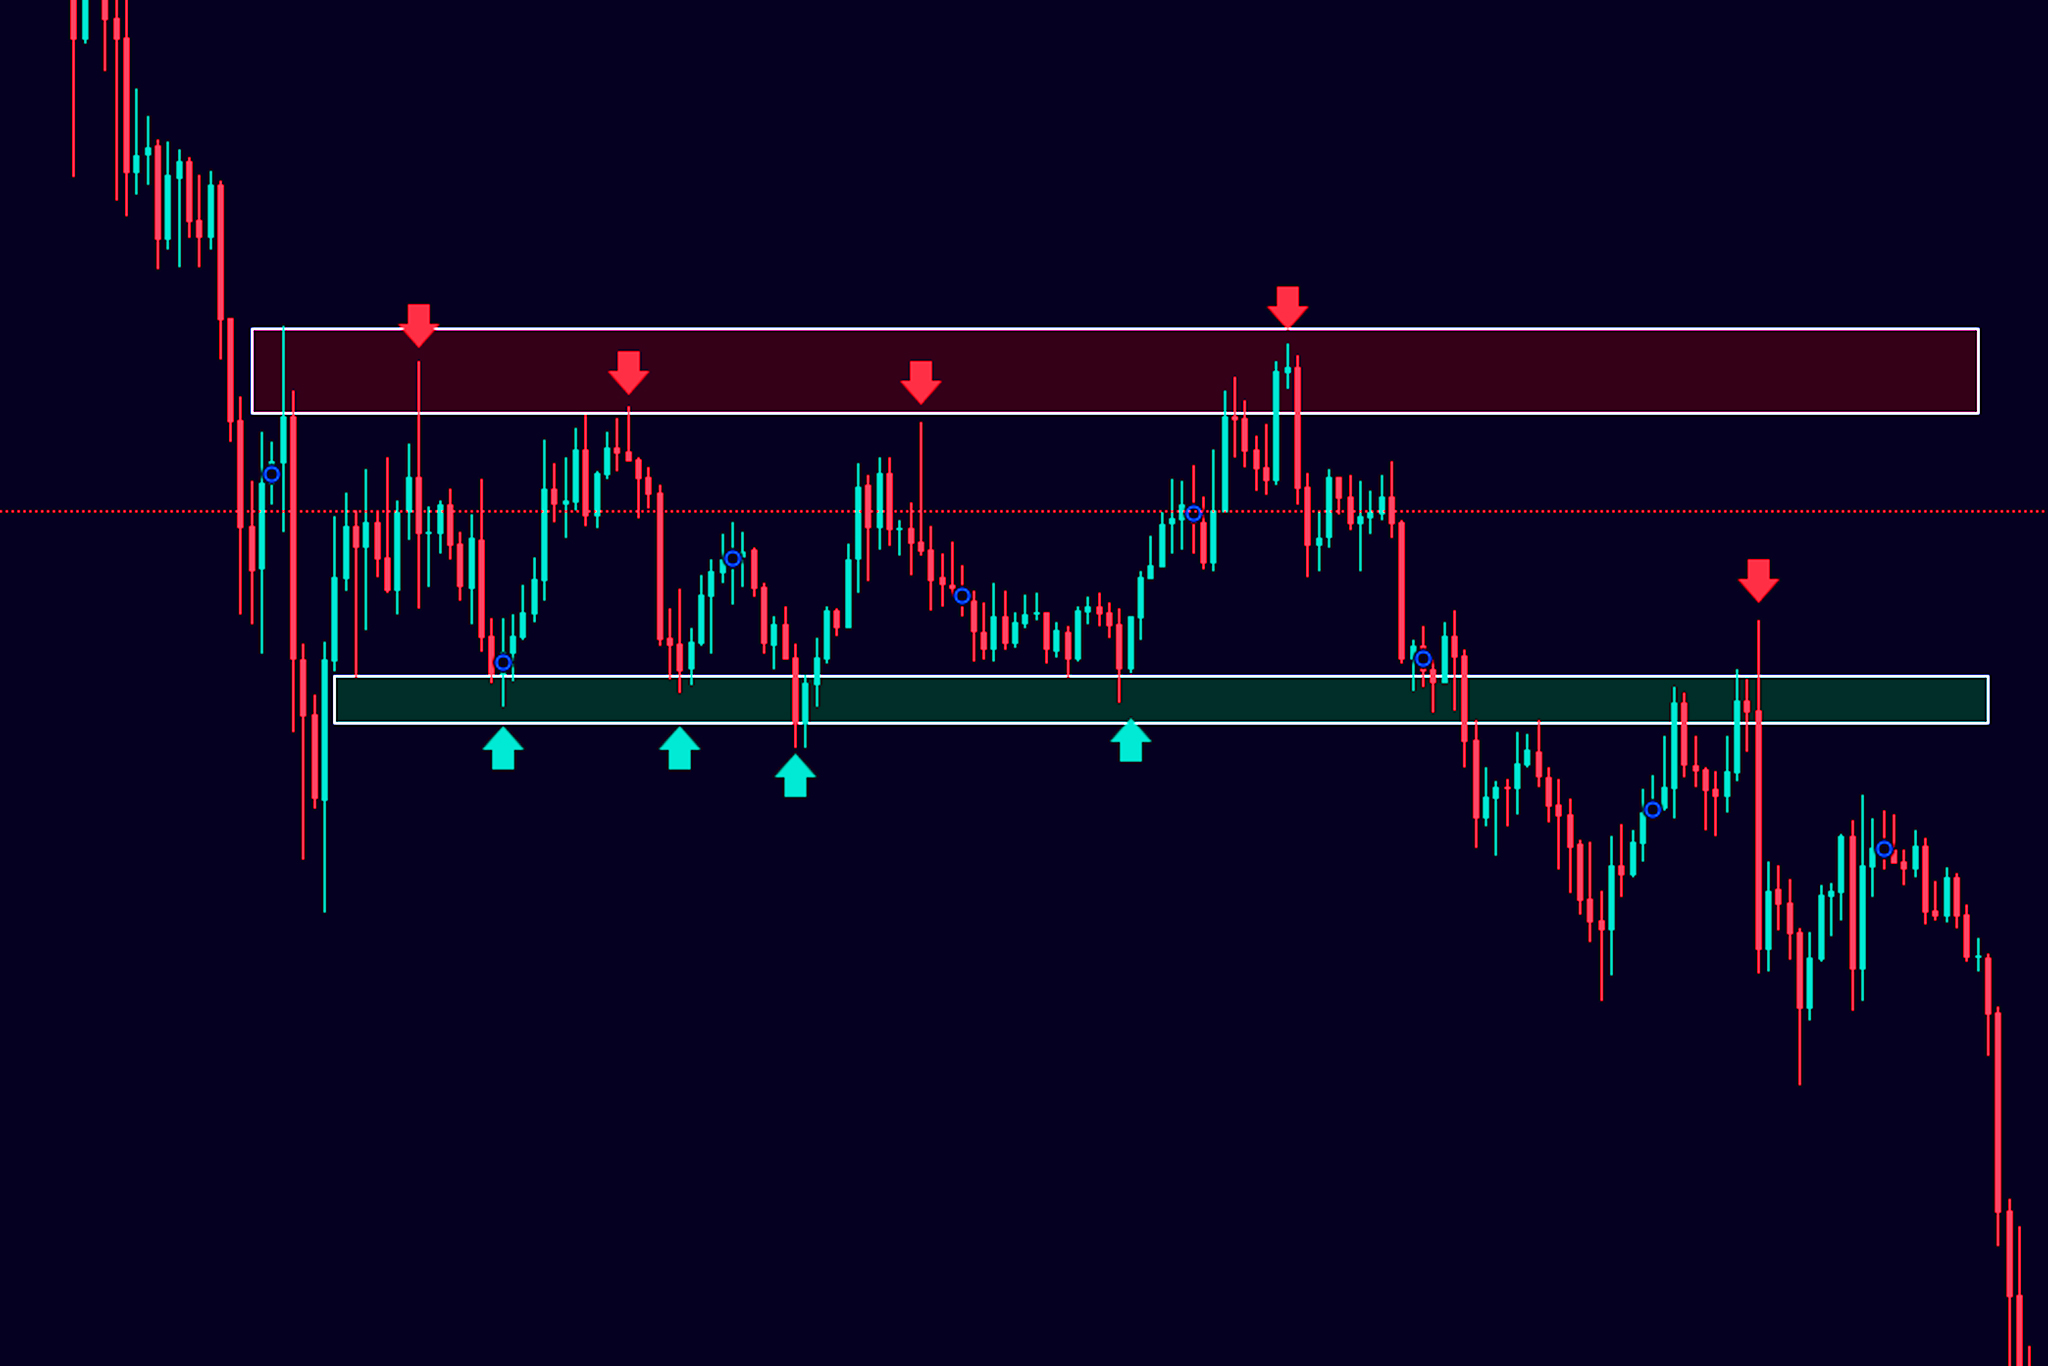
Range trading is a strategy where traders buy at the support level and sell at the resistance level when a market is moving sideways. In simple terms, you’re profiting from the market bouncing up and down within a set price range.
Example:
- If EUR/USD is bouncing between 1.0800 (support) and 1.1000 (resistance), a range trader buys near 1.0800 and sells near 1.1000.
Key Features of Range Trading
| Feature | Description |
|---|---|
| Market Condition | Sideways/Consolidating |
| Entry Points | Near support or resistance |
| Exit Points | Opposite end of the range |
| Timeframe | Works on all, but most effective on 1H, 4H, Daily charts |
| Best Pairs | Major forex pairs with low volatility (e.g., EUR/USD, USD/CHF) |
Advantages of Range Trading
- Simplicity: Easy to understand for beginners
- High Win Rate: More predictable than trend trading in sideway markets
- Risk Control: Clear stop-loss and take-profit levels
Disadvantages
- Breakouts Can Hurt: Sudden price movements beyond support/resistance
- Needs Patience: Ranges don’t last forever
- False Signals: Can be trapped if levels are not well-defined
Tools & Indicators for Range Trading
To succeed with this strategy, you need the right tools. Here are the most effective ones:
1. Support and Resistance Levels
- Identify horizontal price zones where price often reverses.
2. Relative Strength Index (RSI)
- Use RSI to spot overbought (>70) and oversold (<30) zones within a range.
3. Bollinger Bands
- Helps visualize price bouncing between upper and lower bands.
4. Volume Indicators
- Confirm if the bounce has strength; low volume often signals fake-outs.
5. Price Action Patterns
- Candlestick reversals like pin bars or engulfing candles near range boundaries.
Range Trading Systems and Algorithms (Beginner Friendly)
Manual System:
- Step 1: Identify 2–3 touch points on both support and resistance levels
- Step 2: Wait for price to reach support or resistance
- Step 3: Confirm with RSI or candlestick pattern
- Step 4: Enter trade
- Step 5: Set stop-loss outside the range and target the opposite level
Algorithmic Strategy (Intro for Beginners):
A simple automated system can be built with trading platforms like MetaTrader 5 or TradingView.
Logic Example:
- If price near support and RSI < 30 → Buy
- If price near resistance and RSI > 70 → Sell
This can be backtested and optimized using historical data. Platforms like TradingView’s Pine Script make coding such strategies accessible.
Step-by-Step: How to Trade a Range Like a Pro
- Identify the Range
- Look for at least 2 confirmed bounces from both support and resistance.
- Mark the Levels
- Draw clear horizontal lines at the top and bottom of the range.
- Wait for Confirmation
- Don’t jump in. Use indicators like RSI, candlestick patterns, or volume to confirm.
- Enter the Trade
- Buy near support, Sell near resistance
- Set Stop-Loss & Take-Profit
- Place stop-loss just outside the range and target the opposite boundary
- Monitor & Adjust
- If price breaks the range with volume, consider exiting early
Real-Life Example
During the late 2024 USD/CHF market, the pair ranged between 0.8800 and 0.9000 for over a month. Traders who bought near 0.8800 and sold near 0.9000 repeatedly made steady 100–150 pip gains per trade.
This shows how a disciplined range strategy can beat the market without guessing trends.

Pro Tips for Better Results
- Avoid trading during major news events – ranges often break.
- Use alerts – set price alerts to notify you when price nears your levels.
- Don’t overtrade – fewer high-quality trades win.
- Backtest before using real money – always test on demo.
Summary: Why Range Trading Works for Beginners
Range trading gives you a clear structure, defined risk, and high-probability setups in non-trending markets. With tools like RSI, Bollinger Bands, and a disciplined plan, it becomes a powerful way to build early confidence as a forex trader.
If you’re just starting out, this strategy can be your go-to method while you’re still learning how to read market conditions.
📌 Frequently Asked Questions (FAQ)
The best strategy is to buy near support and sell near resistance, using RSI to confirm overbought or oversold conditions. For example, if RSI is below 30 near support, it’s a strong buy signal. Always place a stop-loss outside the range to protect against breakouts.
Imagine EUR/USD is bouncing between 1.0800 and 1.1000. You buy when the price hits 1.0800 and RSI is below 30, and you sell when it hits 1.1000 and RSI is above 70. This approach repeats until the price breaks out of the range.
The top indicators for range trading are:
RSI (Relative Strength Index) – for overbought/oversold levels
Bollinger Bands – to visualize price boundaries
Support & Resistance Lines – for structure
Together, they offer powerful confirmation for entries and exits.
Range trading is a strategy where traders buy low (support) and sell high (resistance) when price moves sideways. It focuses on predictable price bounces within a fixed zone and avoids chasing trends. It’s especially effective when the market has no clear direction.
This refers to using the RSI indicator, where:
Buy when RSI drops below 30 (oversold)
Sell when RSI goes above 70 (overbought)
When combined with range boundaries, this becomes a highly accurate entry/exit signal for range traders.
Pairs like EUR/USD, USD/CHF, and AUD/NZD are known for their stable behavior and frequent ranging periods. These pairs have lower volatility, making them ideal for beginners practicing range strategies.
Yes. Major economic news often causes high volatility, leading to fake breakouts or range invalidation. It’s best to stay out of the market during such events.
Ranges can last from a few hours to several weeks, depending on market conditions and economic events. Always stay alert for signs of breakout.
Absolutely. Because of its structured setup and clear entry/exit points, it’s one of the best strategies for beginners to learn price action and risk management.
Yes. Simple conditions like “Buy when RSI < 30 at support” or “Sell when RSI > 70 at resistance” can be coded using platforms like MetaTrader 5 or TradingView’s Pine Script.
If price breaks through support or resistance with strong volume and momentum, it may start a new trend. In this case, exit your range trade early and avoid trading until a new range is confirmed.
Stop-loss: Just outside the range (below support for buy, above resistance for sell)
Take-profit: At or just before the opposite end of the range
Some of the most effective indicators include:
RSI (to identify overbought/oversold zones)
Bollinger Bands (to visualize boundaries)
Volume indicators (to confirm bounces or breakouts)
The 1-hour, 4-hour, and daily charts are most effective for range trading. They help filter out noise and provide clearer support and resistance levels compared to lower timeframes.
Next Steps
- Try it on a demo account and practice identifying ranges
- Backtest a simple RSI + range strategy on your favorite pair
- Bookmark this guide for future reference
- Share this post with your fellow beginner traders!


