
📌 What You’ll Learn in This Article
- 🐍 Why Python is a game-changer for building your own trading journal in 2025
- 📊 How to track, visualize, and analyze your trades with real performance metrics
- 🔍 Which Python tools and libraries (like Pandas, Matplotlib, and Plotly) you need to get started
- 📈 How to identify patterns in your trading behavior using data—not emotions
- 🧠 Boost your strategy with actionable insights pulled from your own trading history
- 🔁 Automate your journaling process so you can focus on execution, not admin
- 🧪 Customize your dashboard to monitor what actually matters to you as a trader
- 🛠️ Step-by-step structure for building a lightweight yet powerful Python journal
If you’ve ever looked at your trading journal and thought “I wish I could actually make sense of all this data” — you’re not alone. With a bit of code and a clear approach, Python trading journal analysis can completely transform how you review your performance.
In 2025, traders aren’t just relying on gut feeling anymore. The pros use Python trading journal analysis to spot patterns, track results, and optimize strategy using clean, visual data.
The good news? You don’t need to be a data expert to do this. With a simple Python script and your exported CSV file, you can turn raw numbers into visuals that actually tell you what’s working… and what’s not.
The Main Code is Below of this page
🛠 What Does This Python Script Do?
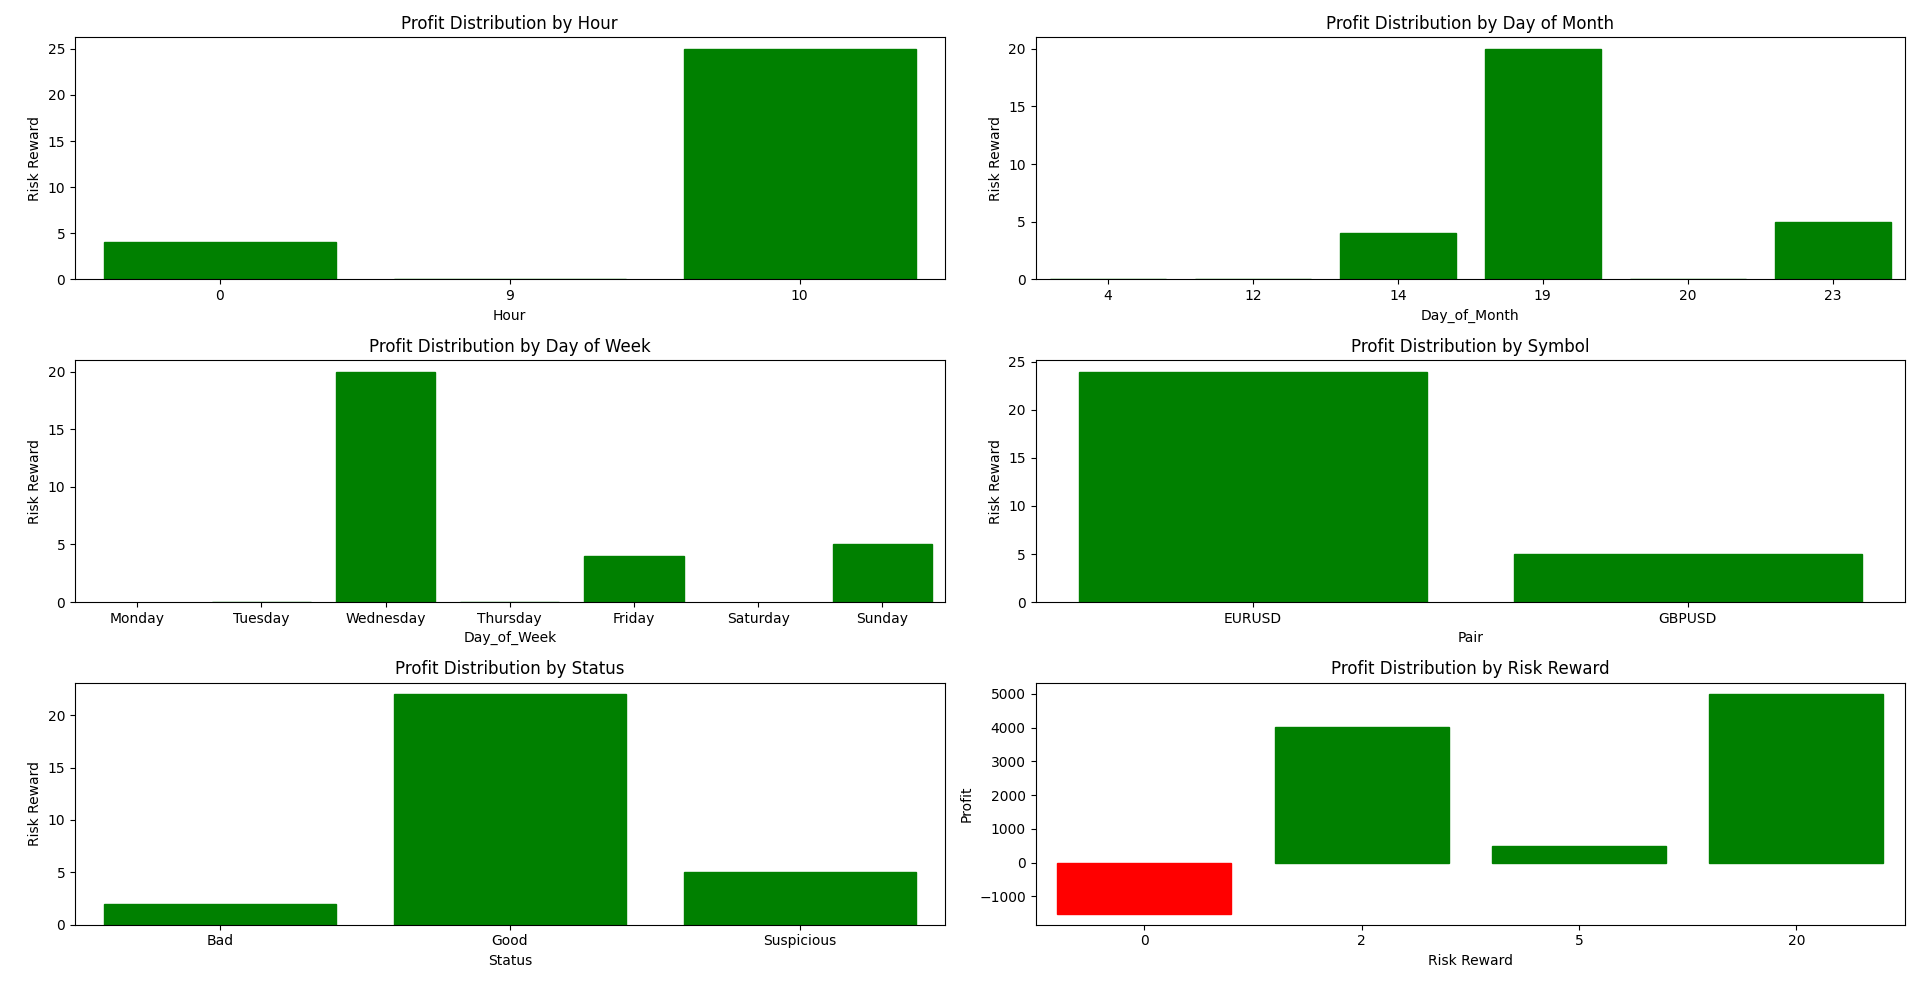
This tool reads your trade history and shows you:
- Which hours of the day you’re most profitable
- Whether you do better at the start or end of the month
- Which days of the week are your strongest
- Which symbols or currency pairs give you the best returns
- Your performance based on win/loss status
- The relationship between risk and reward in your trades
Each chart is color-coded — green for profit, red for loss — so you can quickly scan and understand your strengths and weaknesses.
🚀 How to Use It (Quick Guide)
- Export your trade history as a
.csvfile — name it something liketradejou.csv - Copy and run the Python code in Jupyter Notebook, VS Code, or any Python environment
- Instantly see 6 clear, easy-to-read visual charts of your trading performance
If you’re comfortable with Python, you can tweak the code to analyze even more metrics.
🔎 Behind the Scenes: A Technical Look
This Python-powered script leverages top data science libraries — Pandas, Seaborn, and Matplotlib — to help you analyze your trading data like a pro. It begins by loading the CSV file using:
data = pd.read_csv('tradejou.csv')The Date column is cleaned and converted into a proper datetime object to extract:
Hour: Used for hourly profit analysisDay_of_Month: Reveals day-specific trendsDay_of_Week: Highlights weekday patterns
With just a few lines of code, you unlock powerful insights:
sns.barplot(x='Hour', y='Risk Reward', data=data, estimator=sum)Each chart uses a custom color_bars() function to visually separate winning and losing trades, making the performance overview crystal clear.
📈 Why It Matters for Traders in 2025
In today’s market, success isn’t just about knowing the strategy — it’s about knowing your own performance data. This script helps you:
- Build better risk management
- Time your trades more effectively
- Spot emotional or time-based biases
- Optimize your strategy with real numbers
Whether you’re in Forex, crypto, or stocks, this tool gives you a serious edge — and it’s completely free.
Main Code
import pandas as pd
import matplotlib.pyplot as plt
import seaborn as sns
from datetime import datetime
import matplotlib
matplotlib.use('QtAgg')

# Load the data
data = pd.read_csv('tradejou.csv')

# Preprocess the Date column to remove the timezone information and extra spaces
data['Date'] = data['Date'].str.replace(r'\(GMT\+\d:\d{2}\)', '', regex=True).str.strip()

# Convert Date column to datetime
data['Date'] = pd.to_datetime(data['Date'], format='%B %d, %Y %H:%M')

# Extract hour, day of the month, and day of the week
data['Hour'] = data['Date'].dt.hour
data['Day_of_Month'] = data['Date'].dt.day
data['Day_of_Week'] = data['Date'].dt.day_name()

# Plotting
plt.figure(figsize=(20, 15))

# Function to color bars based on their values
def color_bars(ax):
    for bar in ax.patches:
        if bar.get_height() < 0:
            bar.set_color('red')  # Negative bars in red
        else:
            bar.set_color('green')  # Positive bars in green

# Profit distribution by Hour
plt.subplot(3, 2, 1)
ax1 = sns.barplot(x='Hour', y='Risk Reward', data=data, estimator=sum, errorbar=None)  # Remove error bars
plt.title('Profit Distribution by Hour')
color_bars(ax1)

# Profit distribution by Day of Month
plt.subplot(3, 2, 2)
ax2 = sns.barplot(x='Day_of_Month', y='Risk Reward', data=data, estimator=sum, errorbar=None)
plt.title('Profit Distribution by Day of Month')
color_bars(ax2)

# Profit distribution by Day of Week
plt.subplot(3, 2, 3)
ax3 = sns.barplot(x='Day_of_Week', y='Risk Reward', data=data, estimator=sum, errorbar=None, order=['Monday', 'Tuesday', 'Wednesday', 'Thursday', 'Friday', 'Saturday', 'Sunday'])
plt.title('Profit Distribution by Day of Week')
color_bars(ax3)

# Profit distribution by Symbol
plt.subplot(3, 2, 4)
ax4 = sns.barplot(x='Pair', y='Risk Reward', data=data, estimator=sum, errorbar=None)
plt.title('Profit Distribution by Symbol')
color_bars(ax4)

# Profit distribution by Status
plt.subplot(3, 2, 5)
ax5 = sns.barplot(x='Status', y='Risk Reward', data=data, estimator=sum, errorbar=None)
plt.title('Profit Distribution by Status')
color_bars(ax5)

plt.subplot(3, 2, 6)
ax5 = sns.barplot(x='Risk Reward', y='Profit', data=data, estimator=sum, errorbar=None)
plt.title('Profit Distribution by Risk Reward')
color_bars(ax5)

plt.tight_layout()
plt.show()
🧠 Final Thoughts
If you’ve never visualized your trading data before, you’ll be surprised how much it reveals. In just a few minutes, you can turn raw CSVs into meaningful visuals that help you trade smarter every day.
Want help setting it up or customizing it for your journal? Just ask — I’ll guide you through it.
Also you can Read this : How to Create a Python Trading Library
📌 Frequently Asked Questions About Python trading journal analysis (FAQ)
Absolutely. Python bridges the gap between data and decision-making. It gives traders the power to test strategies, automate tasks, and analyze performance without relying on third-party platforms. That flexibility is key for building long-term profitability.
IBKR offers detailed trade reports but not a customizable trading journal. However, you can export your trade history and integrate it into your own Python-based journal for deeper analytics, better control, and personalized metrics.
Not directly. TradingView runs on its own scripting language, Pine Script. However, many traders use TradingView alerts with webhooks to trigger Python scripts running on external servers or cloud platforms for automation or journaling.
The best journal is one that reflects how you trade. For some, that’s a commercial app with charts. For others, it’s a DIY Python-powered system that adapts to your workflow and evolves with your strategy. Control matters more than convenience.
Yes, many professionals use TradingView for charting, alerts, and strategy visualization. However, for execution and advanced analytics, they often pair it with broker APIs, Excel models, or Python dashboards for a more robust setup.
Not necessarily—but knowing Python is like having a superpower. It’s not a requirement to trade, but it massively expands your edge: custom analytics, smarter automation, and strategy testing at scale. Think of it as trading with X-ray vision.
TradingView uses Pine Script, a lightweight and domain-specific language built just for creating trading indicators and strategies within their platform. It’s simpler than Python but less flexible outside of charting.
Yes. Python is widely used in stock trading—from backtesting to live trading. With APIs from brokers like Alpaca, Interactive Brokers, and others, you can build automated stock trading bots or simply analyze your trades in ways no platform offers.
For ultra-high-frequency trading (HFT), Python isn’t fast enough. But for 99% of traders—retail, swing, day, or even institutional—it’s fast and readable, making it perfect for strategy development, journaling, and smart automation.
Yes, it’s legal—provided your bot or AI follows market regulations and doesn’t engage in manipulative behavior. Many hedge funds use AI. The key is transparency, compliance, and using APIs from regulated brokers.
Any recent version of Python 3 (like Python 3.10+) works great for trading. What matters more is the ecosystem: use libraries like Pandas, NumPy, Backtrader, and Plotly to unlock Python’s full trading potential.
Yes, and it’s one of the most powerful ways to truly understand your edge. With Python, you can visualize performance, filter emotions from trades, and optimize your system—not just your next setup.


