- 📊 What Is a Forex Chart?
- 🔍 Why Forex Charts Matter
- 🧩 The Building Blocks of a Forex Chart
- 📈 Types of Forex Charts
- 🕒 Understanding Timeframes
- 💡 How to Read Candlesticks Like a Pro
- 📐 Spotting Support, Resistance & Trends
- 📊 Popular Chart Patterns Every Beginner Should Know
- ⚙️ Using Indicators (But Not Overusing Them)
- 🪜 Step-by-Step: How to Read a Live Forex Chart
- ⚠️ Common Mistakes Beginners Make
- 💬 People Also Ask (FAQ)
- 🏁 Final Thoughts: Reading Charts with Confidence
Learning to read forex charts is one of the most important steps in becoming a confident trader. Charts are more than just colorful lines and candles , they are the visual language of the market.
In this guide, you’ll learn exactly how to understand, analyze, and act on what the charts are telling you even if you’re a complete beginner.
📊 What Is a Forex Chart?
A forex chart shows how a currency pair’s price changes over time. The horizontal axis (X-axis) represents time, while the vertical axis (Y-axis) represents price.
Each point or candle on the chart tells a story about what traders thought, feared, or expected at that moment.
When you look at a chart of EUR/USD, for example, you’re seeing how much one euro costs in U.S. dollars and how that relationship changes second by second.
🔍 Why Forex Charts Matter
Forex charts aren’t just pretty visuals; they are a decision-making tool. They help you:
- Spot trends and potential reversals
- Identify key support and resistance levels
- Measure volatility and momentum
- Plan entries and exits with precision
Without charts, you’d be trading blind.
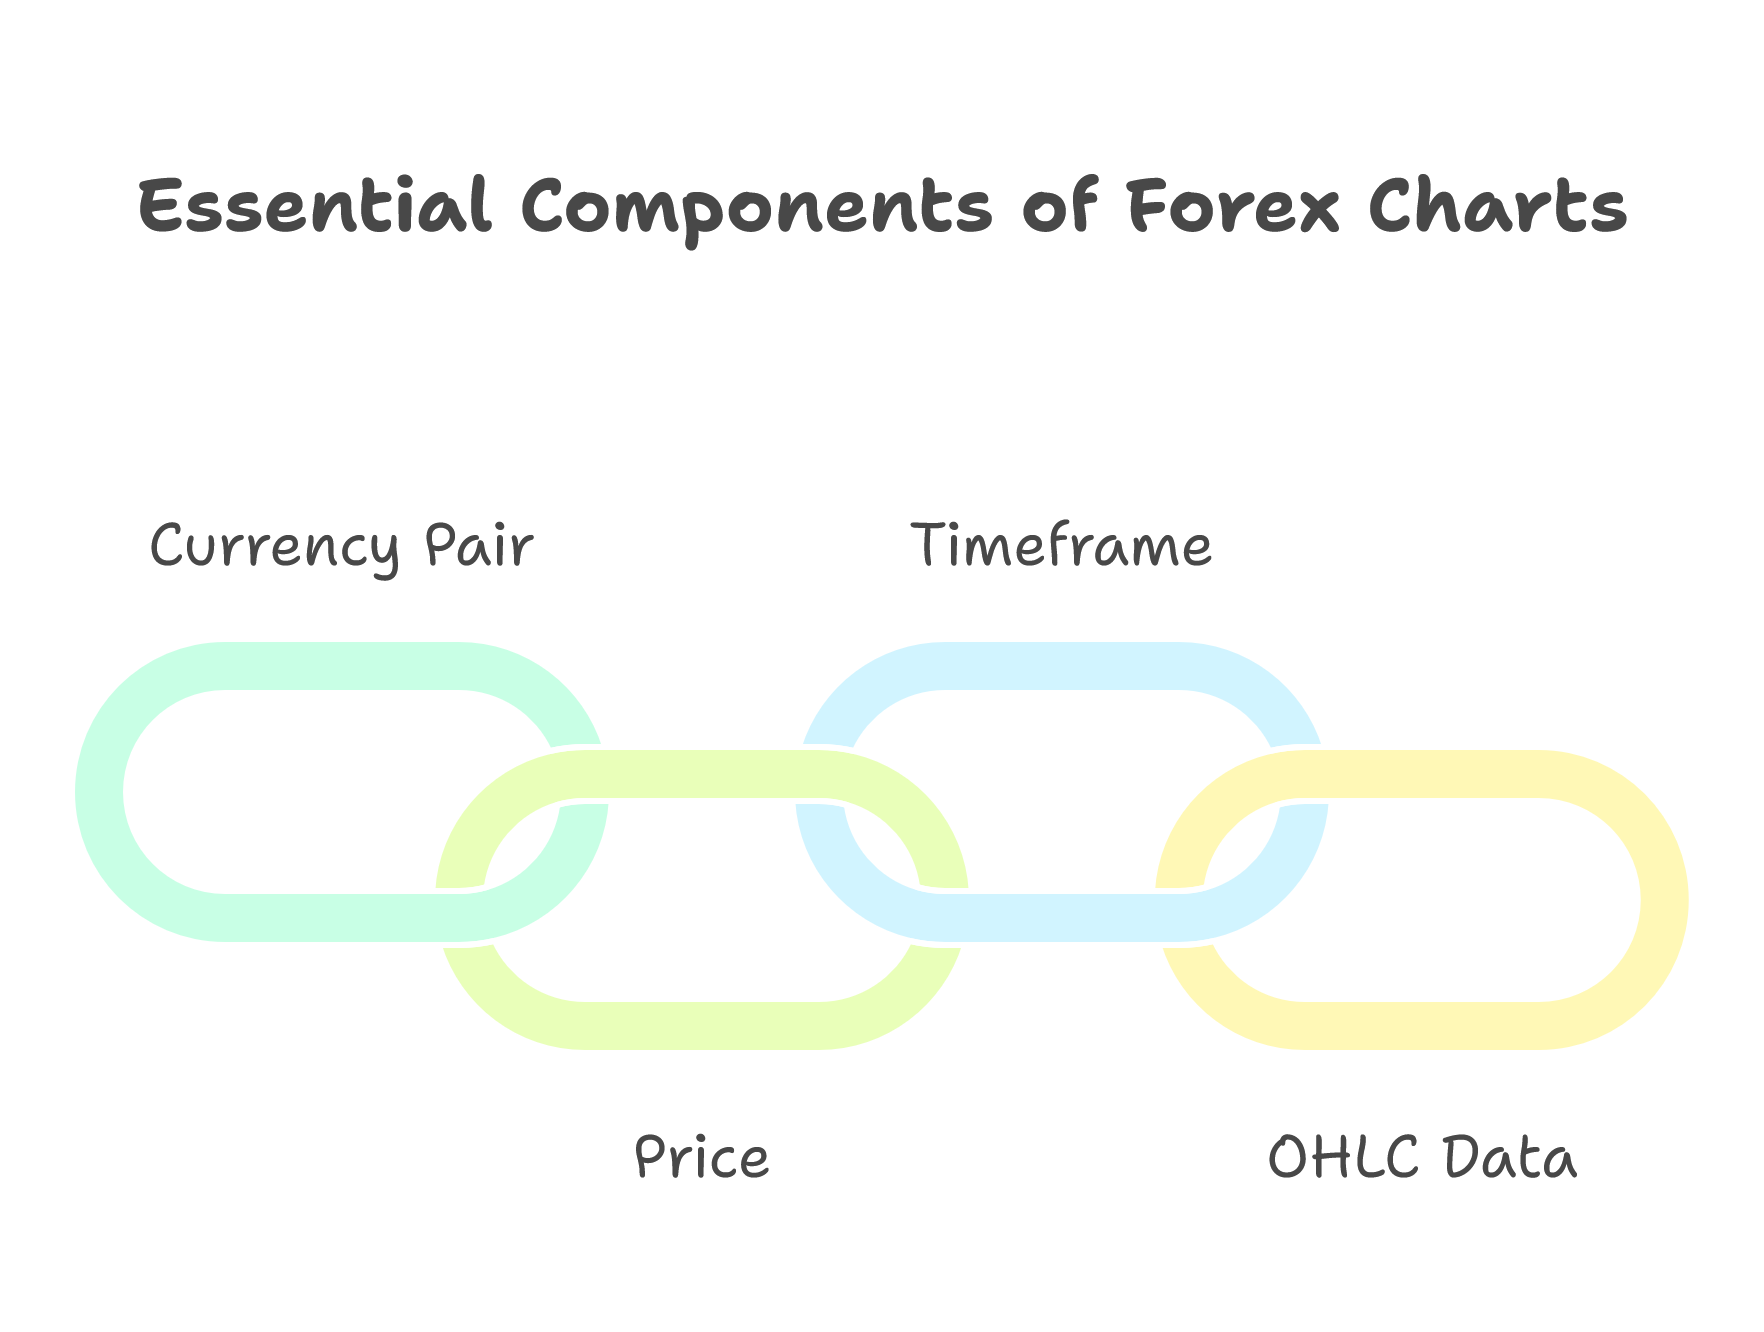
🧩 The Building Blocks of a Forex Chart
Every chart is made up of the same core elements:
- Currency Pair – e.g., GBP/USD or XAU/USD (gold vs. USD).
- Price – how much one unit of the base currency is worth in the quote currency.
- Timeframe – the period each candle or bar represents (1 minute, 1 hour, 1 day, etc.).
- OHLC Data – every candle shows the Open, High, Low, and Close prices for that period.
Once you can read these, you can interpret almost any chart on any trading platform.
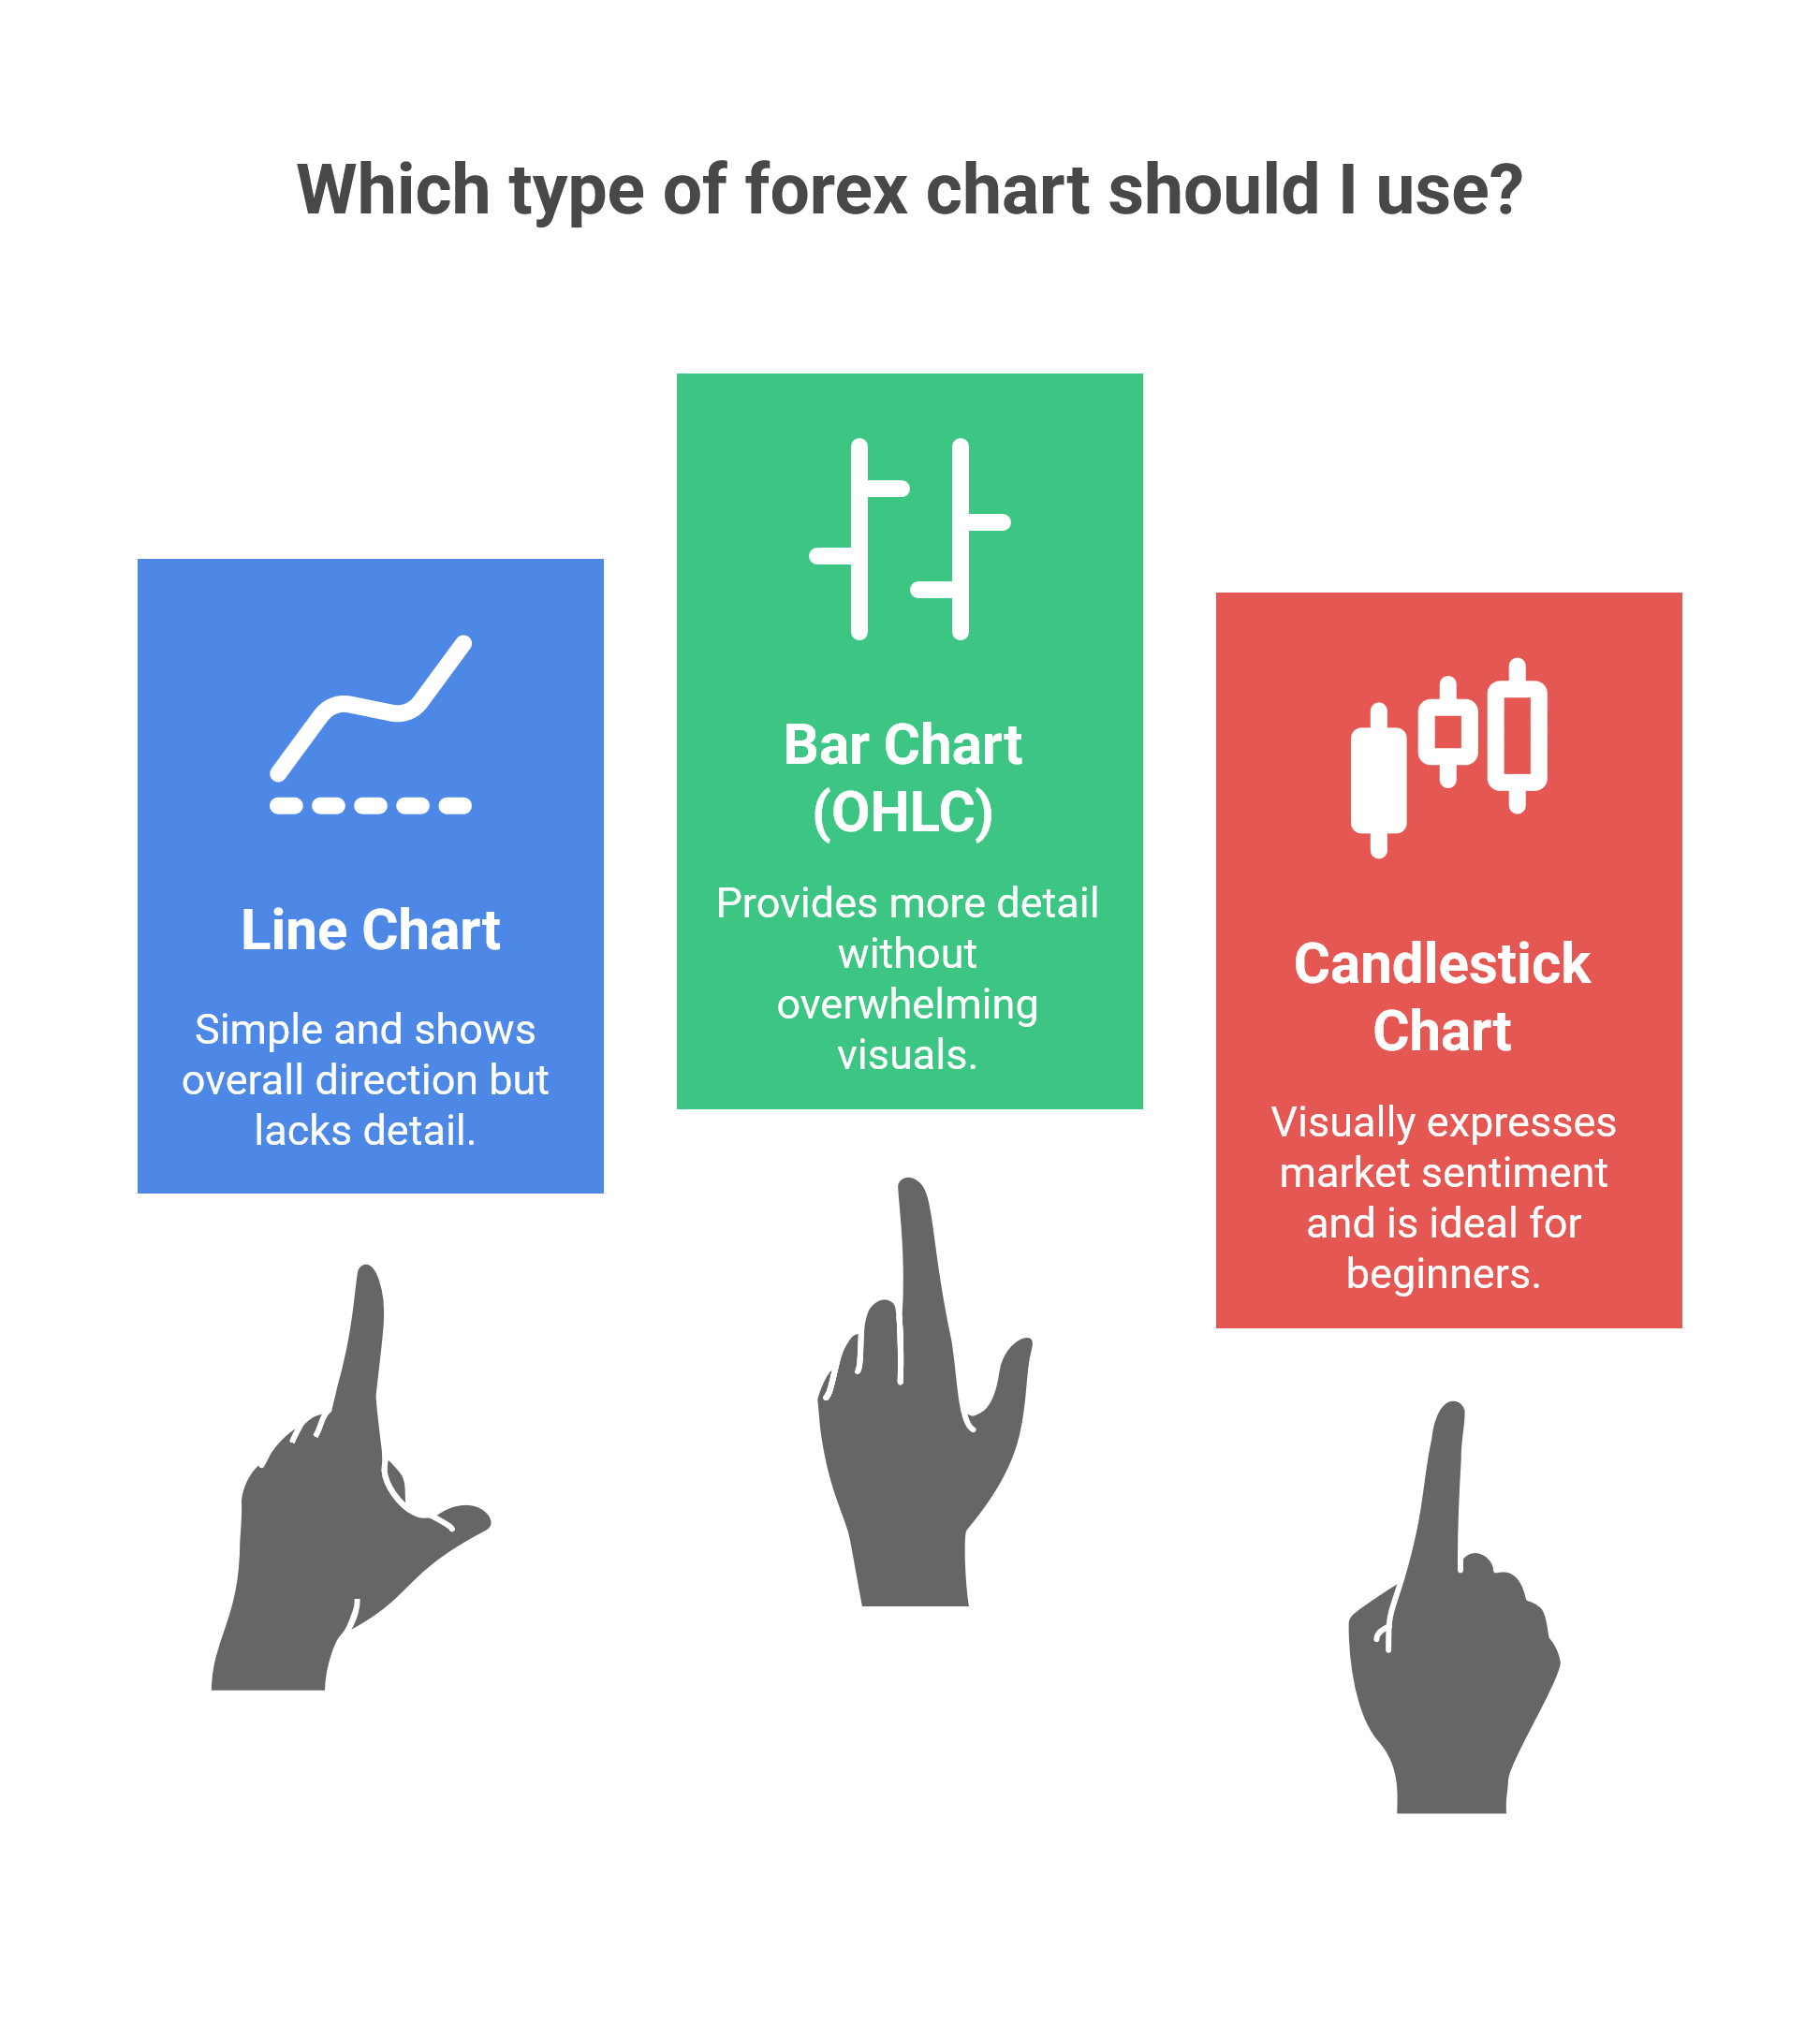
📈 Types of Forex Charts
Different chart types show the same price information in different ways. Here are the three main ones:
1. Line Chart
A line chart connects the closing prices of each period with a single continuous line.
It’s simple and great for spotting overall direction, but it hides details like intraday highs and lows.
2. Bar Chart (OHLC)
A bar chart displays each period’s open, high, low, and close as vertical bars.
- The top of the bar = the high
- The bottom = the low
- The left tick = open
- The right tick = close
Bar charts give you more detail about price action without overwhelming visuals.
3. Candlestick Chart
The most popular type each candle has a body (open–close) and wicks (high–low).
A green or white candle means price closed higher than it opened (bullish).
A red or black candle means it closed lower (bearish).
Candlestick charts are ideal for beginners because they visually express market sentiment at a glance.
🕒 Understanding Timeframes
Every chart is divided into timeframes 1 minute, 15 minutes, 1 hour, 4 hours, daily, weekly, and monthly.
Each candle on a 1-hour chart represents one hour of price movement, while a daily chart shows an entire trading day in one candle.
🔸 Pro Tip:
Use multiple timeframes to see the full picture:
- The daily chart shows the big trend.
- The 1-hour chart fine-tunes entries and exits.
- The 15-minute chart helps time short-term trades.
Never trade on a single timeframe alone context matters.
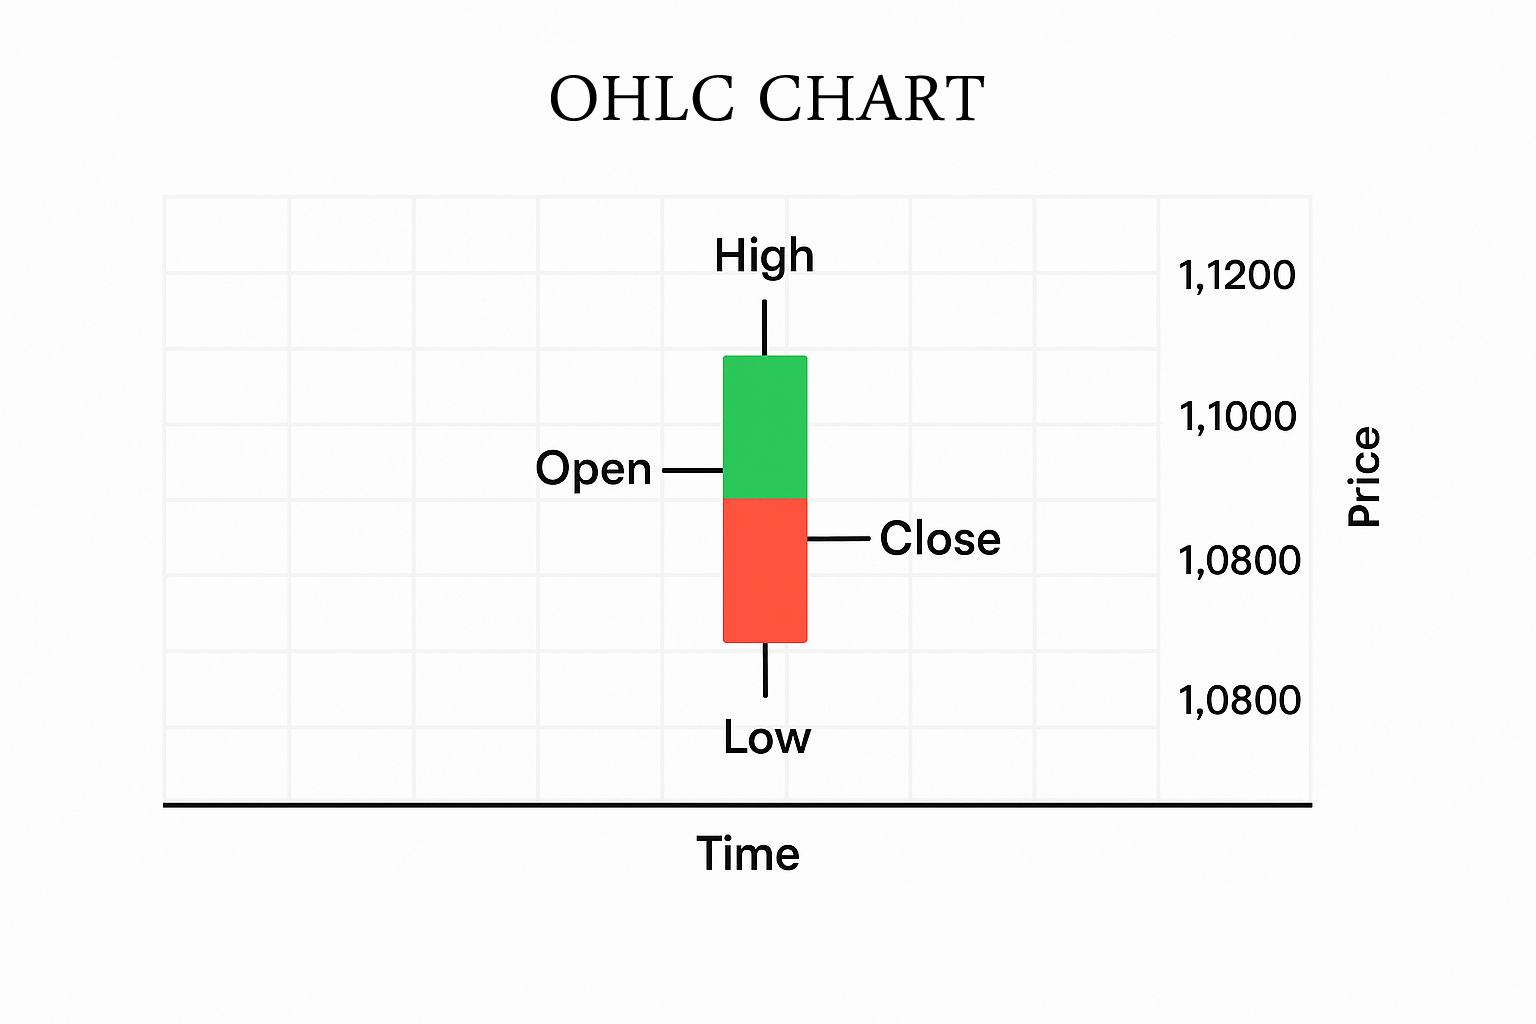
💡 How to Read Candlesticks Like a Pro
Each candlestick gives you four key data points:
Open, High, Low, and Close often called OHLC.
When you combine these over time, you can see how traders’ emotions shift between fear and greed.
Common Candlestick Patterns:
| Pattern | What It Means |
|---|---|
| Doji | Market indecision neither bulls nor bears in control |
| Hammer | Reversal signal when seen after a downtrend |
| Engulfing | A strong candle that “swallows” the previous one powerful reversal clue |
| Morning Star / Evening Star | Three-candle patterns signaling trend change |
Candlestick analysis works best when combined with support/resistance and trendlines, not by itself.
📐 Spotting Support, Resistance & Trends
Support and resistance are the anchors of technical analysis:
- Support is a level where price tends to stop falling.
- Resistance is a level where price tends to stop rising.
Draw them on your chart where price has bounced multiple times before.
These levels help you predict future turning points.
Trend Types:
- Uptrend: Higher highs and higher lows
- Downtrend: Lower highs and lower lows
- Range / Sideways: Price oscillates between horizontal boundaries
When the market breaks through support or resistance, it often signals the start of a new trend.
📊 Popular Chart Patterns Every Beginner Should Know
Patterns repeat because human psychology repeats.
Here are a few you’ll recognize as you gain experience:
🔹 Reversal Patterns
- Head and Shoulders → Uptrend to Downtrend
- Double Top / Bottom → Major turning points
- Inverted Head and Shoulders → Bearish to Bullish switch
🔹 Continuation Patterns
- Flags and Pennants → Short pauses in strong trends
- Triangles → Compression before breakout
- Rectangles → Sideways consolidation
Spotting these early gives you a big edge in timing entries.
⚙️ Using Indicators (But Not Overusing Them)
Indicators are helpful but only when used correctly.
Think of them as tools, not crutches.
The Most Useful Indicators for Beginners:
- Moving Average (SMA / EMA) – smooths price action to show the trend
- RSI (Relative Strength Index) – shows if the market is overbought or oversold
- MACD – measures trend strength and momentum
- Bollinger Bands – identifies volatility and breakout opportunities
Use a maximum of two indicators per chart.
The best traders keep things simple and rely mostly on price action.
🪜 Step-by-Step: How to Read a Live Forex Chart
Here’s a simple routine you can practice daily:
- Open your charting platform (e.g., MetaTrader, TradingView).
- Select a currency pair — let’s say EUR/USD.
- Choose your timeframe — start with 1-hour or 4-hour charts.
- Identify the trend — draw a trendline or channel.
- Mark support and resistance — note key price levels.
- Look for candlestick patterns — like a hammer or engulfing candle.
- Add 1–2 indicators for confirmation.
- Plan your entry, stop-loss, and take-profit levels.
- Review your setup before placing a trade.
This routine helps you read charts logically not emotionally.
⚠️ Common Mistakes Beginners Make
- Trading without identifying the main trend
- Ignoring risk management
- Jumping into trades after emotional impulses
- Using too many indicators
- Skipping backtesting or demo practice
Avoid these traps and your learning curve will shorten dramatically.
💬 People Also Ask (FAQ)
Start with a free demo account. Focus on understanding candlesticks, timeframes, and support/resistance. Practice identifying trends and patterns before risking real money.
The line chart is the easiest, but candlestick charts give you more detail about trader psychology.
Draw a trendline. If price makes higher highs and higher lows, it’s an uptrend; lower highs and lower lows indicate a downtrend.
Yes, but sparingly. Use one trend indicator (like a moving average) and one momentum indicator (like RSI). Focus on simplicity and clarity.
With consistent daily practice, most traders become comfortable within 6–8 weeks. The key is repetition and journaling your analysis.
🏁 Final Thoughts: Reading Charts with Confidence
Reading forex charts is not about memorizing patterns — it’s about understanding price behavior.
Every candle represents decisions made by millions of traders worldwide.
By learning to interpret that behavior, you turn data into insight — and insight into opportunity.
If you dedicate time to practice and keep your charts clean, you’ll soon see what professional traders see: patterns, probabilities, and possibilities.
✅ Next Step:
📘 Bookmark this guide and open a demo chart today.
you can learn more about forex in Forex hub for beginners
Trace trends, draw lines, and practice spotting reversals.
The more charts you read, the more fluent you’ll become in the language of forex.


