- What Statistical Arbitrage Really Is And Why It Isn’t “Just” Arbitrage
- Why Forex Markets Are Especially Suited (But Also Demanding) for Statistical Arbitrage
- Step-by-Step: How to Build Your Own Forex Statistical Arbitrage Strategy
- Real-World Forex Statistical Arbitrage Examples You Can Visualize
- Five Most Asked Questions (Answered with Unseen Nuance)
- Advanced Twist You Won’t Always See Customising statistical arbitrage for 2026 and Beyond
- Final Words Is Statistical Arbitrage Worth It for You?
What Statistical Arbitrage Really Is And Why It Isn’t “Just” Arbitrage
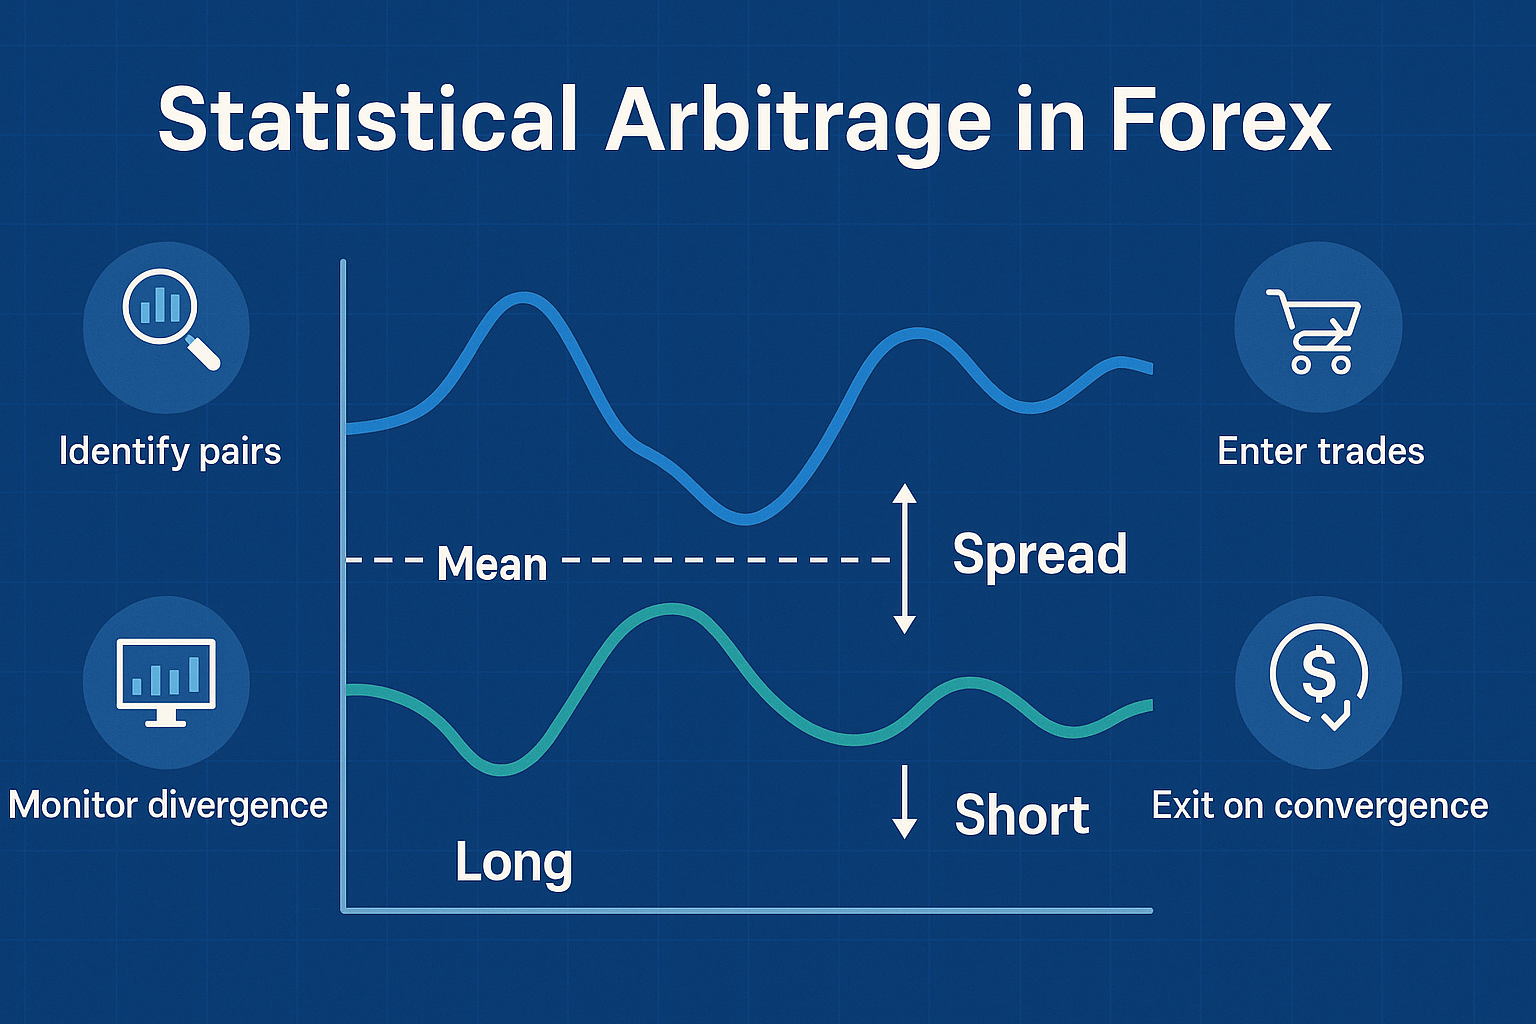
When people hear “arbitrage” they think: buy low in one market, sell high in another, lock in a risk-free profit. In the world of forex, the strategy we’ll explore is subtler and more enduring: statistical arbitrage (often shortened to statistical arbitrage).
Instead of spotting blatant mispricings, statistical arbitrage exploits the hidden relationships between two or more currency pairs relationships that have behaved in a certain way historically and may temporarily deviate, giving you a potential edge.
What makes it compelling:
- It’s about relationships (how pair A moves relative to pair B), not just the level of pair A or the level of pair B in isolation.
- It’s about temporal deviations a spread or ratio that wanders abnormally, then tends to revert.
- It leverages probability and data, not just directional bets like “EUR will go up vs USD.”
In forex, where thousands of pairs move in tandem or opposite ways due to shared economics (e.g., commodity movements, central-bank policy, regional correlations), this kind of strategy can be particularly fertile.
Why Forex Markets Are Especially Suited (But Also Demanding) for Statistical Arbitrage
Here’s why the FX arena both invites and challenges statistical arbitrage:
What works in favour
- Massive liquidity: Many major currency pairs trade hundreds of billions daily → you can open/close positions with relative ease.
- Lots of pair-combinations: With dozens of publicly quoted major and minor , you have a broad “playground” to find correlated or cointegrated pairs.
- Continuous trading hours (5 days a week) → you don’t have to wait for the next market open to adjust your positions.
- Shared drivers: For example, AUD & NZD share commodity & regional factors; EUR & GBP share European macro; USD‐centric pairs often respond similarly to global risk sentiment.
The hidden demands
- Relationships aren’t static: Correlations can drift, cointegrations can break. What held last year may not hold tomorrow.
- Execution & cost matter: The profit “edge” in statistical arbitrage is often small spreads, slippage, financing/rollover costs in forex can erode it.
- Risk of model breakdown: Because you’re relying on a statistical relationship, if that relationship weakens or shifts (due to macro shock, central-bank intervention, liquidity event) the trade may go wrong.
- Data & infrastructure: You’ll ideally need historical data, statistical tools, alerts/automation to spot deviations quickly and act.
Step-by-Step: How to Build Your Own Forex Statistical Arbitrage Strategy
This is your actionable roadmap with unique emphasis on how to keep it simple but effective.
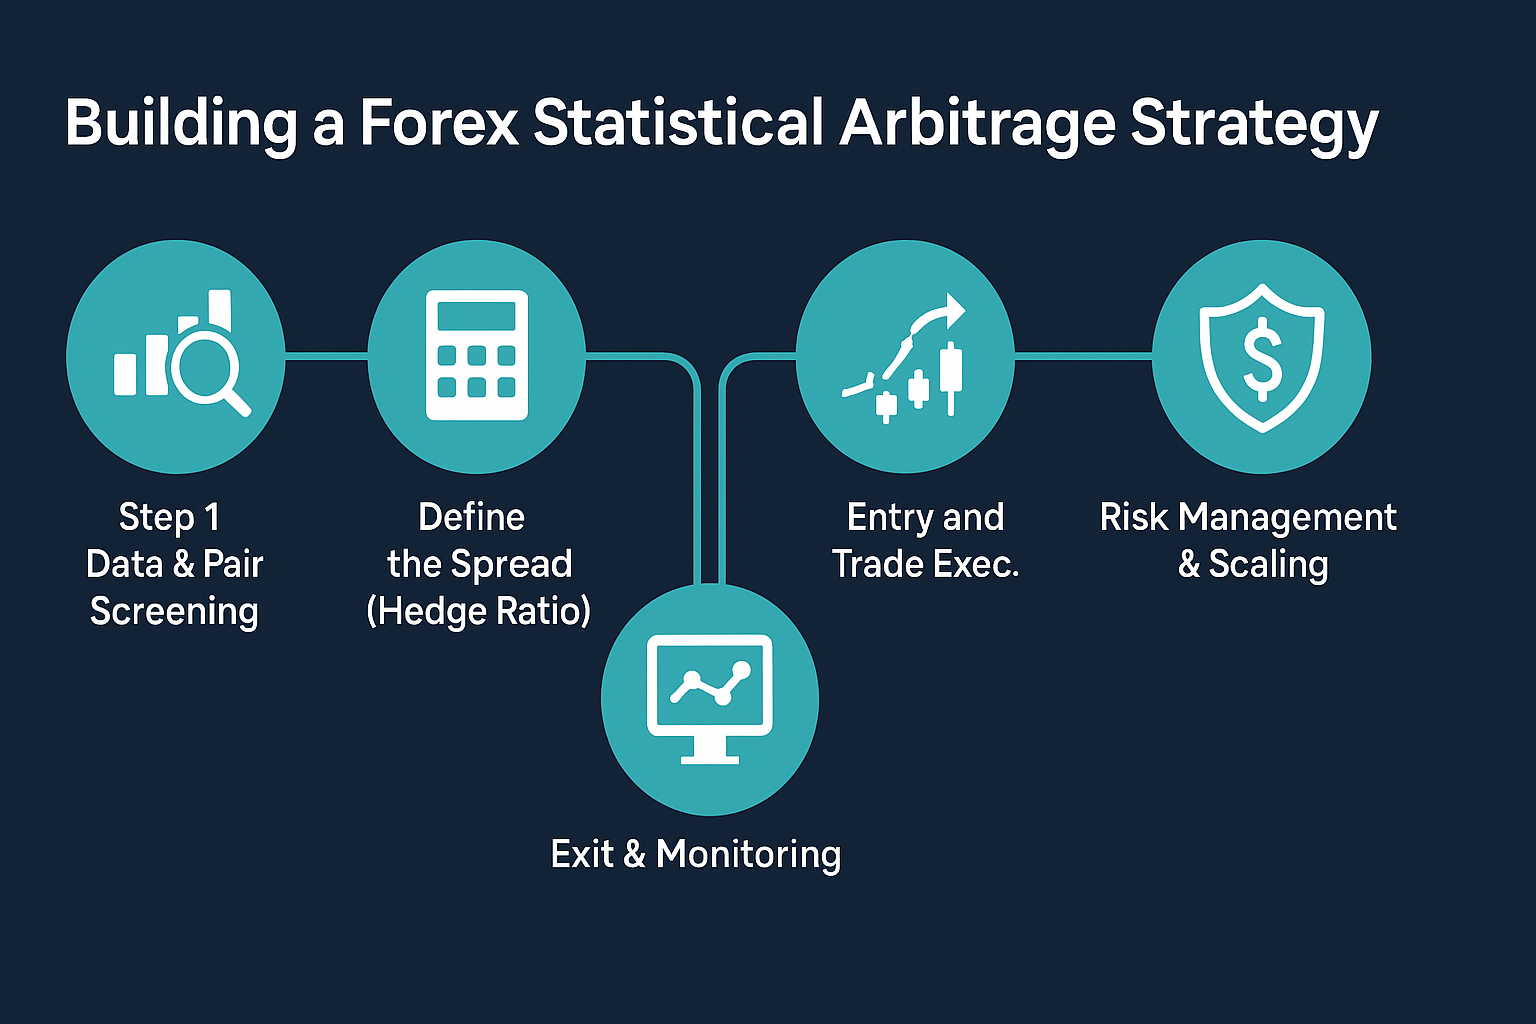
Step 1: Data & pair screening
- Choose a universe of currency pairs (for instance: major majors like EUR/USD, GBP/USD, AUD/USD, NZD/USD, USD/JPY).
- Compute correlation coefficients across different time-frames (e.g., daily returns over last 1 year, 6 months).
- Run cointegration tests (e.g., Augmented Dickey-Fuller on the spread) to filter pairs whose spread behaves like a stationary process (meaning it tends to revert).
Step 2: Define the spread (hedge ratio)
- For a pair of interest (say EUR/USD vs GBP/USD), you compute a hedge ratio via regression (Price (A) = β × Price (B) + ε).
- The “spread” becomes: ε = Price (A) – β × Price (B).
- You monitor that spread when it wanders “too far” from its historical mean (e.g., > +2 σ or < –2 σ), a trade signal may trigger.
Step 3: Entry and trade execution
- If spread is high positive (A overpriced vs B) → short A and go long B.
- If spread is high negative (A underpriced vs B) → long A and short B.
- Set stop-loss/take-profit based on historical reversion magnitude and time-to-reversion.
Step 4: Exit & monitoring
- Exit when spread reverts to mean (or hits acceptable target).
- If spread keeps diverging (breaking structure) beyond your threshold/time limit → cut losses.
- Continuously re-test pair behaviour if cointegration deteriorates, drop the pair.
Step 5: Risk management & scaling
- Limit exposure: Because many trades may have small individual edge, you need diversified positions (many pairs) to average out noise.
- Monitor costs: Spread cost, slippage, rollover interest & broker fees matter.
- Portfolio neutrality: By going long one leg and short another, you aim to reduce directional FX risk (so you’re not purely betting on USD going up or down).
- Keep logs/backtests: If your model degrades, retire it and re-screen.
Real-World Forex Statistical Arbitrage Examples You Can Visualize
Here are two concrete examples tailored for FX, with fresh interpretation.
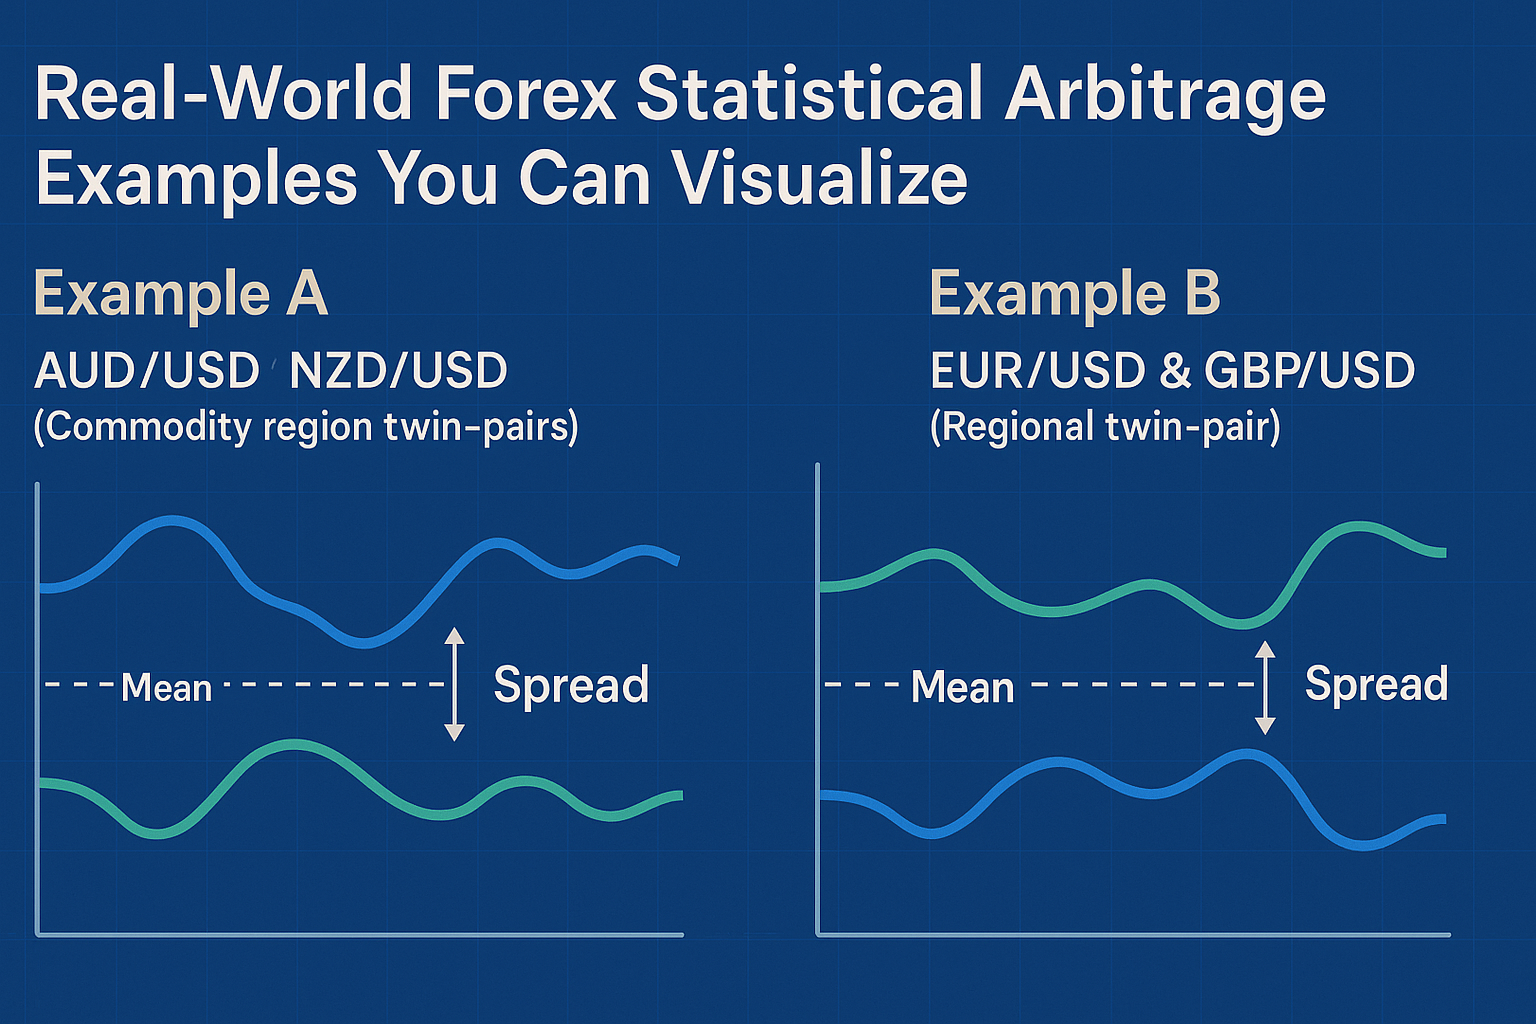
Example A – AUD/USD & NZD/USD (Commodity region twin-pairs)
These two often move together because both Australia and New Zealand export commodities and share risk sentiment. Suppose historically the spread (AUD/USD – β×NZD/USD) has mean ~0.0030 (in log-terms). Then:
- One week, NZD/USD holds firm but AUD/USD surges because of a strong iron-ore price. Spread widens to 0.0050.
- statistical arbitrage trade: short AUD/USD, long NZD/USD (with hedge ratio) expecting the spread to shrink.
- Two weeks later, iron-ore price corrects, AUD/USD weakens, NZD/USD holds spread collapses back to ~0.0030 → you exit for profit.
Example B – EUR/USD & GBP/USD (Regional twin-pair)
Similarly, EUR and GBP share European macro-moves (ECB/BoE decisions, risk-sentiment in Europe). Suppose cointegration holds between these two. Scenario:
- Unexpected UK political news weakens GBP sharply – GBP/USD falls, but EUR/USD holds relatively steady. Spread widens.
- You go long GBP/USD (under-performing), short EUR/USD (over-performing) expecting convergence.
- When UK risk sentiment normalises, and GBP recovers relative to EUR → you profit.
Five Most Asked Questions (Answered with Unseen Nuance)
Here are five of the most common questions traders ask about statistical arbitrage in Forex answered in a fresh way.
1. “Is Statistical Arbitrage risk-free since it claims to exploit mispricings?”
Short answer: No it isn’t “risk-free”.
Why: While traditional arbitrage aims to lock in a riskless profit (if done instantly), statistical arbitrage relies on correcting relationships that are probabilistic. The relationship might not revert when you expect, or it might shift entirely due to macro events. Model risk, execution delay, cost of carry in FX (rollovers) all introduce risk. So your edge is small probability excess return, not guaranteed profit.
2. “What time-frames work best for Statistical Arbitrage in Forex?”
There’s no one-size-fits-all, but here are some nuanced thoughts:
- Many retail traders apply it on daily or 4-hour charts: this gives sufficient data for statistical relationships and manageable trade-lengths.
- Institutional setups may go to intraday/micro-second (HFT) level but that introduces much heavier infrastructure cost.
- Important: the time-frame must match your data-quality, cost structure and execution ability. If you trade too fast but your broker execution lags/spread blows out, you lose. If you pick too slow, the relationship may break in between.
3. “How do I pick ‘good’ currency-pairs for Statistical Arbitrage?”
Here’s the refined checklist:
- Choose pairs with shared underlying economic drivers (e.g., commodity-linked FX, regionally linked currencies).
- Confirm high correlation (e.g., > 0.80) and ideally cointegration (spread is stationary over time).
- Check liquidity: Major pairs with low spreads are preferred (to keep costs low).
- Perform historical robustness tests: how often did the spread revert? How often did it diverge long term or break down?
- Avoid pairs with known structural breaks (e.g., currency pegs removed, wars, major central-bank interventions) unless you adjust for them.
4. “Does automation/algorithms matter? Can I do Statistical Arbitrage manually?”
You can do a simplified version manually but automation gives you scale and speed which often separates winners from losers.
Manual mode is possible if you:
- Monitor just a few well-chosen pairs
- Use simple entry/exit rules
- Accept lower trade frequency and slower reaction
Automation helps if you: - Track hundreds of pair-combinations continuously
- Execute swiftly when deviation threshold is hit
- Automate data collection, signal generation, execution
- Manage many small trades so the “edge” (which might be small per trade) accumulates
In short: start manually to learn, but if you want to scale or capture fleeting opportunities you’ll likely need automation.
5. “What happens when the statistical relationship breaks down – how do I protect myself?”
This is one of the most under-discussed risks in Statistical Arbitrage. Relationship breakdown means the spread no longer behaves as expected (it drifts further, doesn’t revert). Here’s how to guard against it:
- Continuously monitor correlation & cointegration statistics. If they drop below your threshold, retire the pair.
- Set time-based stop-limits: If the spread hasn’t reverted in X days (based on your historical expectation), close the trade.
- Use stop-losses (even though you might be market-neutral directionally, FX still has funding/rollover costs) so a runaway spread doesn’t cause catastrophic loss.
- Diversify across multiple pair-sets: Don’t rely on a single relationship.
- Stay aware of fundamental drivers: A sudden macro-shock (e.g., Brexit-type event) may break many pairs simultaneously. In such times, you may want to pause your statistical arbitrage system.
Advanced Twist You Won’t Always See Customising statistical arbitrage for 2026 and Beyond
Here are a few “next-level” ideas to keep your system ahead of the curve:
• Rolling Window Re-calibration
Instead of relying on one static historical period for correlation/cointegration, use a rolling window (e.g., last 90 days or last 180 days) that updates your metrics weekly or monthly. This adapts to changes in market structure and keeps your pair relationships fresh.
• Multi-Leg Portfolios
Instead of just one pair, build a mini-portfolio of 3-5 pairs that you treat as a “statistical basket”. You monitor a composite spread (weighted across pairs) and trade when the basket diverges. This multiplies your diversification and effectiveness.
• Cost & Carry Layering
In forex we have rollover/interest-carry (the cost/benefit of holding currencies overnight). When you are long one and short another, the net carry cost matters. Build carry into your model: a pair might have perfect spread behaviour but high negative net carry this reduces your net edge.
• Fundamental Event Filters
Before entering a trade, filter pair-divergences by upcoming fundamental events (central-bank meetings, data releases, geopolitical risk). If one of the paired currencies has a big event inbound, maybe pause that pair for this trade to avoid breakdown risk.
Final Words Is Statistical Arbitrage Worth It for You?
If you’re reading this, you likely already use or consider using directional forex trading (guessing which way EUR/USD will go). Statistical arbitrage offers a different paradigm: you’re betting on relationships reverting, not just absolute moves.
Yes, it can be worth it if you’re prepared for:
- Data-work and model-building (or using someone else’s model)
- Discipline: the “edge” per trade may be modest and drawdowns real
- Risk management: model breakdowns, cost drains, unknown unknowns
But it also offers: - A more market-neutral approach (less exposed to big direction bets)
- A structure where you can diversify across many pair relationships
- A potentially repeatable strategy (when well-built) that may resist being “just another guess”
My recommendation: if you’re curious, test it on a demo or small live account, build your historic stats, track performance including costs, then decide whether to scale.
Forex Arbitrage Strategy: How It Works + Is It Still Profitable in 2026?


