What is EURUSD in 2026 based on 2025 data?
EURUSD in 2026 refers to forward expectations for the euro–US dollar pair derived from 2025 price behavior. By analyzing 2025 monthly ranges, volatility distribution, and directional structure, traders can assess probable volatility regimes, liquidity zones, and structural bias for 2026.

2. QUICK FACT SUMMARY
- Definition: Analysis of 2025 EURUSD price structure to anticipate 2026 behavior
- Why it matters: Volatility regimes often persist or transition gradually
- Who should use it: Swing traders, intraday traders, algorithmic systems
- Best timeframes: H4, Daily, Weekly for structure; M15–H1 for execution
- Risk level: Moderate to high, depending on leverage and volatility expansion
3. DEEP EXPLANATION
2025 Volatility Structure
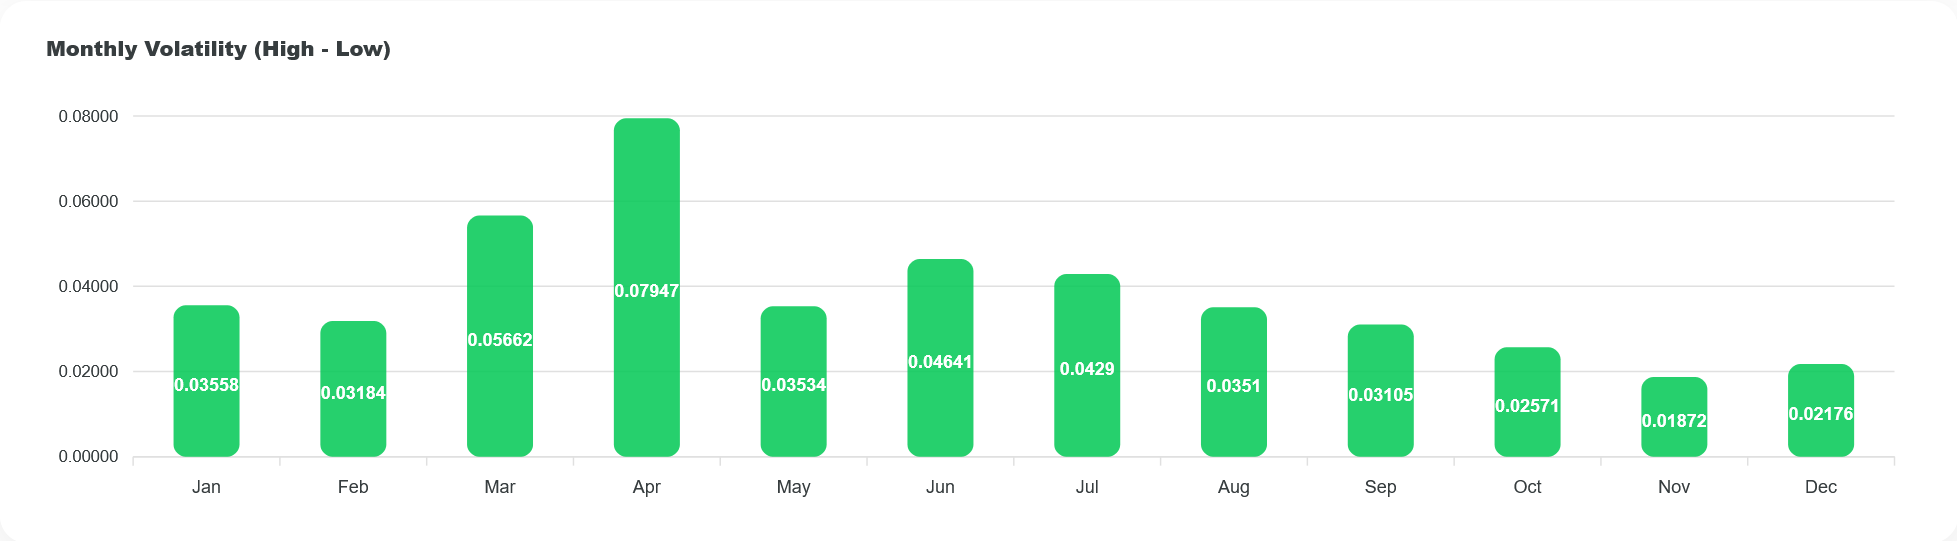
In 2025, EURUSD showed uneven volatility distribution. Monthly ranges peaked in April (0.07947) and remained elevated through mid-year. Meanwhile, late 2025 volatility compressed significantly, with November posting only 0.01872.
This shift suggests a transition from expansion to compression. Markets rarely stay compressed for extended periods without preparing for re-expansion.
Monthly Behavior and Structural Bias
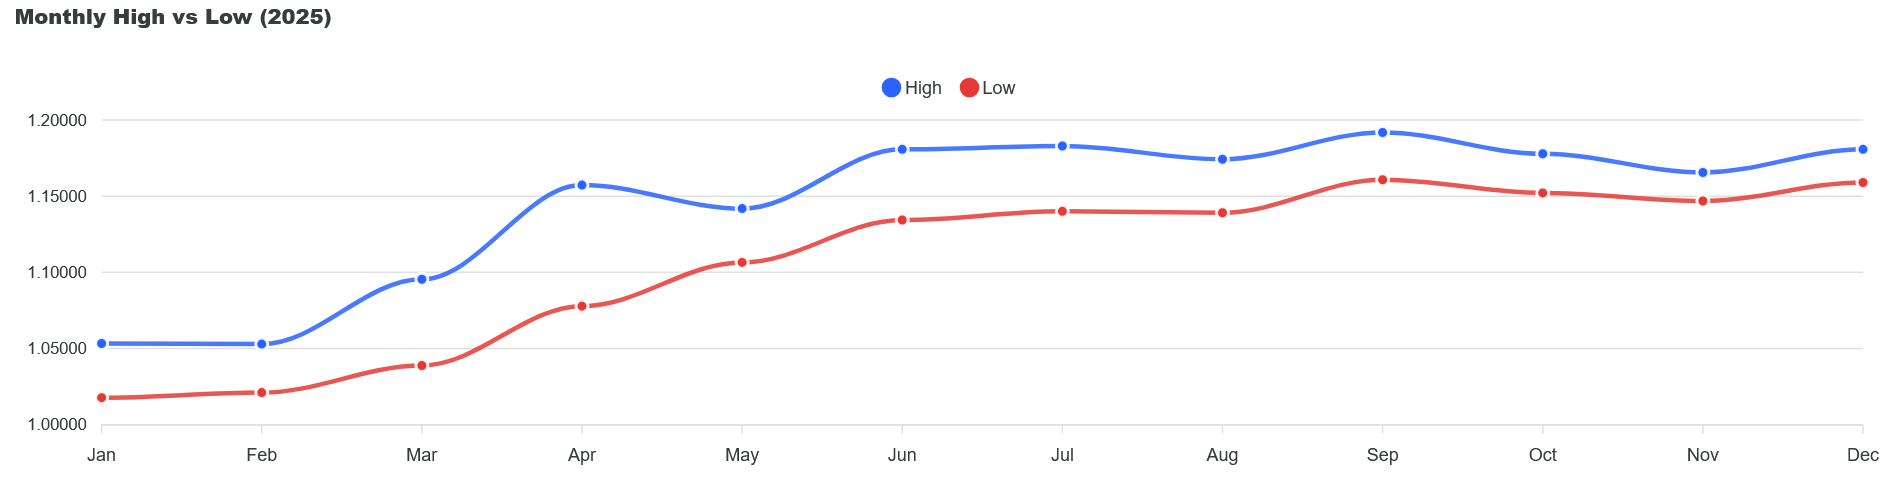
The highest yearly price reached 1.19186 in September, while the lowest was 1.01772 in January. The total yearly expansion exceeded 1700 pips.
However, the strongest expansion phase occurred in Q2. After July, upside continuation slowed. This behavior often reflects profit-taking and macro repricing rather than trend reversal.
Liquidity and Trader Psychology
High-volatility months typically indicate aggressive institutional repositioning. April’s range suggests large macro flows, likely driven by rate expectations or policy divergence.
Conversely, late-year compression signals indecision. Retail traders often overtrade during compression, while institutions accumulate positions quietly.
If 2025 ended in compression, 2026 statistically opens with volatility expansion.
4. HOW IT WORKS (STEP-BY-STEP)
Step 1: Identify 2025 Range Extremes
Action: Mark yearly high (1.19186) and yearly low (1.01772).
Reason: These levels define macro liquidity pools.
Common mistake: Treating mid-range levels as major structural zones.
Step 2: Analyze Volatility Regime
Action: Compare early-year vs late-year monthly ranges.
Reason: Volatility cycles often rotate annually.
Common mistake: Assuming volatility stays constant.
Step 3: Observe Compression Signals
Action: Study November–December low ranges.
Reason: Compression precedes expansion.
Common mistake: Forcing breakout trades before confirmation.
Step 4: Align With Macro Themes
Action: Compare rate differentials and ECB/Fed policy direction.
Reason: EURUSD responds strongly to monetary divergence.
Common mistake: Ignoring macro drivers in long-term bias.
5. REAL MARKET APPLICATION
When It Works
This analysis works best in trending or transitioning macro environments. If volatility expands after compression, breakout systems benefit.
Swing traders can position around yearly extremes. Algorithmic traders can adjust ATR-based stop models accordingly.
When It Fails
It becomes unreliable during unexpected geopolitical shocks or sudden policy shifts. Structural analysis cannot predict black swan events.


Required Conditions
- Clear macro narrative
- Liquidity returning after holiday compression
- Volume confirmation on breakouts
Risk Considerations
- Overleveraging during volatility expansion
- Mistaking temporary spikes for structural shifts
- Ignoring correlation with DXY and bond yields
6. COMMON MISTAKES
| Mistake | Why It Happens | Fix |
|---|---|---|
| Ignoring yearly high/low | Focus on intraday noise | Start with weekly chart |
| Overtrading low volatility | Impatience | Wait for range expansion |
| Misreading compression | Expect immediate breakout | Confirm with volume and structure |
| Using tight stops in expansion | Underestimating ATR growth | Adjust position sizing |
| Ignoring macro drivers | Pure technical bias | Track ECB and Fed data |
| Confusing pullback with reversal | Emotional bias | Follow higher timeframe trend |
7. ADVANCED INSIGHT (E-E-A-T)
From experience managing both discretionary and algorithmic systems, volatility compression phases often precede institutional accumulation.
When ranges shrink below historical averages, liquidity providers widen spreads less aggressively. Meanwhile, large participants build positions using passive orders.
In 2025, late-year compression likely reflects positioning ahead of 2026 macro repricing. If rate differentials shift, EURUSD in 2026 could revisit 1.20 liquidity or sweep below 1.02 before rebalancing.
Professional traders monitor:
- Options positioning
- COT reports
- Yield spreads
- Dollar index divergence
Execution quality matters more during expansion phases, as slippage increases significantly.
8. FAQ
If volatility expands from 2025 compression, trending conditions become more likely. Confirmation requires macro alignment.
Likely due to macro repricing and institutional repositioning, often linked to rate expectations.
Yes, yearly highs often act as liquidity magnets in the following year.
Only with proper risk management and higher timeframe confirmation.
Compression is neutral. Direction depends on breakout catalyst.
Yes. Most adaptive systems adjust position size using ATR or variance models.
9. CONCLUSION
EURUSD in 2026 will likely be shaped by the volatility compression seen at the end of 2025. Historical behavior suggests expansion typically follows contraction.
Swing traders, intraday traders, and algorithmic systems should prepare for regime transition rather than assume continuation of low volatility. The next logical step is combining this structural view with macro rate expectations and liquidity mapping.